
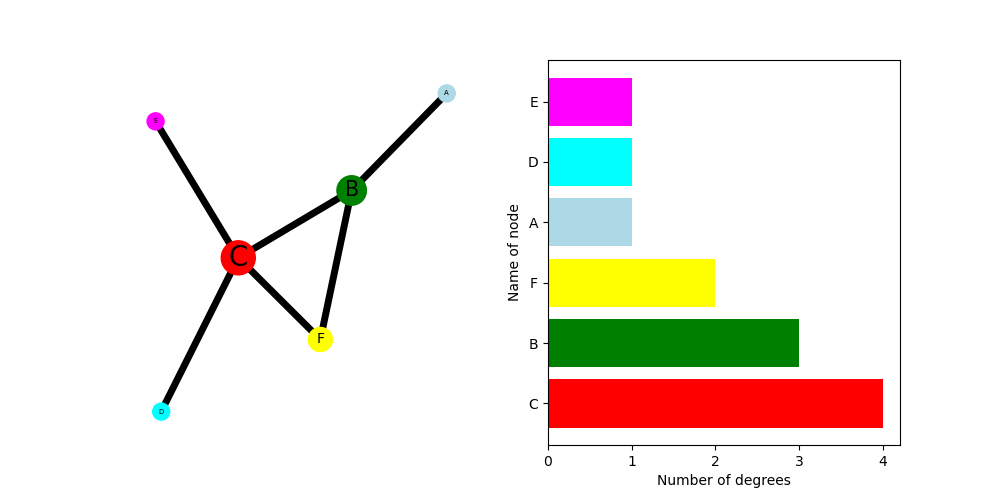
ラベルの大きさを調整したくて困っています。
出来ればノードの大きさを参照できるようにできれば幸いです。
よろしくお願いします。
python
1import matplotlib.pyplot as plt 2import networkx as nx 3 4G = nx.Graph() 5 6G.add_nodes_from(["A","B","C","D","E","F"]) 7G.add_edges_from([("A","B"),("B","C"),("B","F"),("C","D"),("C","E"),("C","F"),("B","F")]) 8 9 10print("number of nodes:",G.number_of_nodes()) 11print("nodes:",G.nodes()) 12 13print("number of edges:",G.number_of_edges()) 14print("edges:",G.edges()) 15 16print("degrees:",G.degree()) 17 18#ノードの大きさを決定 19#ネットワーク全体の次数の平均値を計算 20average_deg = sum(d for n,d in G.degree()) / G.number_of_nodes() 21#ノードの次数に比例するようにサイズを設定 22sizes = [300 * deg / average_deg for node,deg in G.degree()] 23 24colors = ["lightblue","green","red","cyan","magenta","yellow"] 25 26nodes_sorted_by_degree = sorted(G.degree(),key = lambda x: x[1],reverse = True) 27print(nodes_sorted_by_degree) 28 29colors_dict = dict(zip(G.nodes(),colors)) 30colors_sorted = [colors_dict[node] for node, _ in nodes_sorted_by_degree] 31print(colors_sorted) 32 33plt.figure(figsize = (10,5)) 34plt.subplot(121) 35nx.draw(G, 36 with_labels = True, 37 node_color = colors, 38 edge_color = "black", 39 node_size = sizes, 40 width = 5) 41 42x,height = list(zip(*nodes_sorted_by_degree)) 43plt.subplot(122) 44plt.xlabel("Number of degrees") 45plt.ylabel("Name of node") 46plt.barh(x, height, color = colors_sorted) 47plt.show()
回答1件
あなたの回答
tips
プレビュー


2022/06/22 06:53