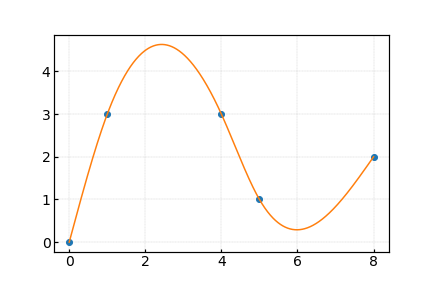
Pythonで行列の計算をし,パラメータを算出したいです.xとyの値は例として挙げています.予定ではクリックで点を生成し,その点をふやしていくことを考えています.つまり点の個数が決まっていなくても,図のような行列の計算はできますでしょうか.最終的な結果としてcというパラメータの値を取り出したいです.
よろしくお願い致します.
(追記)
手計算によって求めた解を載せます。また,これらの行列は離散点を3次スプライン補間をする際の3次多項式のパラメータの一部(c)を求める式になります。
よろしくお願い致します。
| x | y |
|---|---|
| 0 | 0 |
| 1 | 3 |
| 4 | 3 |
| 5 | 1 |
| 8 | 2 |
気になる質問をクリップする
クリップした質問は、後からいつでもMYページで確認できます。
またクリップした質問に回答があった際、通知やメールを受け取ることができます。
バッドをするには、ログインかつ
こちらの条件を満たす必要があります。
2020/07/23 17:05
回答4件
0
x,yにリストとして座標を追加し、numpyの配列に変換すれば以下のソースコードで計算できると思います。
Ax=rとして解いた。a,b,c,dは三次関数の係数。
python
1import numpy as np 2 3x = np.array([0, 1, 4, 5, 8]) 4y = np.array([0, 3, 3, 1, 2]) 5n = len(x)-1 6h = x[1:]-x[:-1] 7a = y 8 9# 対角成分 10Adiag = np.eye(n+1) 11Adiag[1:-1, 1:-1] *= 2*(h[:-1]+h[1:]) 12 13# 対角成分の一つ下の斜めの成分 14Alower = np.eye(n+1, k=-1) 15Alower[1:, :-1] *= h 16Alower[-1, -2] = 0 17 18# 対角成分の一つ上の斜めの成分 19Aupper = np.eye(n+1, k=1) 20Aupper[:-1, 1:] *= h 21Aupper[0, 1] = 0 22 23A = Adiag + Alower + Aupper 24 25# Aの逆行列 26Ainv = np.linalg.inv(A) 27 28r = np.zeros(n+1) 29r[1:-1] = (3/h)[1:]*(a[2:]-a[1:-1])-(3/h)[:-1]*(a[1:-1]-a[:-2]) 30 31c = np.dot(Ainv, r) 32 33d = (c[1:]-c[:-1])/(3*h) 34b = (a[1:]-a[:-1])/h-h/3*(2*c[:-1]+c[1:]) 35print("x", x, "y", y) 36print("h", h, "a", a) 37print("A") 38print(A) 39print("r", r) 40 41print("a", a) 42print("b", b) 43print("c", c) 44print("d", d)
text
1x [0 1 4 5 8] y [0 3 3 1 2] 2h [1 3 1 3] a [0 3 3 1 2] 3A 4[[1. 0. 0. 0. 0.] 5 [1. 8. 3. 0. 0.] 6 [0. 3. 8. 1. 0.] 7 [0. 0. 1. 8. 3.] 8 [0. 0. 0. 0. 1.]] 9r [ 0. -9. -6. 7. 0.] 10a [0 3 3 1 2] 11b [ 3.31018519 2.37962963 -1.96759259 -1.5462963 ] 12c [ 0. -0.93055556 -0.51851852 0.93981481 0. ] 13d [-0.31018519 0.04578189 0.48611111 -0.10442387]
投稿2020/07/23 11:26
編集2020/07/23 21:22総合スコア698
バッドをするには、ログインかつ
こちらの条件を満たす必要があります。
0
ベストアンサー
パラメータ表示でやってみた。
python
1import numpy as np 2import matplotlib.pyplot as plt 3 4# スプライン曲線のパラメータを求める。 5def calculateSplineParameter(x): 6 # t = 0,1,2,...,x.size-1とする。 7 n = x.size-1 8 h = np.ones(n) 9 a = x 10 11 # 対角成分 12 Adiag = np.eye(n+1) 13 Adiag[1:-1, 1:-1] *= 2*(h[:-1]+h[1:]) 14 15 # 対角成分の一つ下の斜めの成分 16 Alower = np.eye(n+1, k=-1) 17 Alower[1:, :-1] *= h 18 Alower[-1, -2] = 0 19 20 # 対角成分の一つ上の斜めの成分 21 Aupper = np.eye(n+1, k=1) 22 Aupper[:-1, 1:] *= h 23 Aupper[0, 1] = 0 24 25 A = Adiag + Alower + Aupper 26 27 # Aの逆行列 28 Ainv = np.linalg.inv(A) 29 30 r = np.zeros(n+1) 31 r[1:-1] = (3/h)[1:]*(a[2:]-a[1:-1])-(3/h)[:-1]*(a[1:-1]-a[:-2]) 32 33 c = np.dot(Ainv, r) 34 d = (c[1:]-c[:-1])/(3*h) 35 b = (a[1:]-a[:-1])/h-h/3*(2*c[:-1]+c[1:]) 36 37 return [a,b,c,d] 38 39# 三次関数の係数から, 元の点から間の点を求める。 40def calculateInterpolationPoints(splineParameter, orignalPointsNumber, interpolationPointsNumber=1000): 41 a, b, c, d = splineParameter 42 43 index = np.repeat(np.arange(orignalPointsNumber-1), interpolationPointsNumber, axis=0) 44 t = np.tile(np.linspace(0, 1, interpolationPointsNumber), orignalPointsNumber-1) 45 46 return a[index] + b[index]*t + c[index]*t**2 + d[index]*t**3 47 48# 補間したい点の座標 49x = np.random.rand(20) 50y = np.random.rand(x.size) 51 52parameterX = calculateSplineParameter(x) 53parameterY = calculateSplineParameter(y) 54 55X = calculateInterpolationPoints(parameterX, x.size) 56Y = calculateInterpolationPoints(parameterY, y.size) 57 58plt.plot(X, Y, label="spline curve") 59plt.plot(x, y, marker='o', linestyle='None', label='original points') 60plt.legend() 61plt.savefig("graph.png", dpi=200,figsize=(4,3))
周期3次スプライン曲線を使って閉曲線にしました。
Periodic cubic smoothing splines as a quadratic
minimization problem
python
1import numpy as np 2import matplotlib.pyplot as plt 3 4 5# 周期3次スプライン曲線のパラメータを求める。 6def calculatePeriodicSplineParameter(x): 7 # t = 0,1,2,...,x.size-1とする。 8 n = x.size - 1 9 h = np.ones(n) 10 a = x 11 12 # 対角成分 13 Adiag = np.zeros((n, n)) 14 Adiag[1:, 1:] = np.diag(2 * (h[:-1] + h[1:])) 15 Adiag[0][0] = 2 * (h[-1] + h[0]) 16 Alower = np.diag(h[:-1], k=-1) 17 Aupper = np.diag(h[:-1], k=1) 18 19 A = Adiag + Alower + Aupper 20 A[-1][0] = h[-1] 21 A[0][-1] = h[-1] 22 23 # 対角成分 24 Vdiag = np.zeros((n, n)) 25 Vdiag[1:, 1:] = np.diag(-(1 / h[:-1] + 1 / h[1:])) 26 Vdiag[0][0] = -(1 / h[-1] + 1 / h[0]) 27 Vlower = np.diag(1 / h[:-1], k=-1) 28 Vupper = np.diag(1 / h[:-1], k=1) 29 30 V = Vdiag + Vlower + Vupper 31 V[-1][0] = h[-1] 32 V[0][-1] = h[-1] 33 34 r = 3 * np.dot(V, a[:-1]) 35 36 c = np.linalg.solve(A, r) 37 38 c = np.insert(c, c.size, c[0]) 39 40 d = (c[1:] - c[:-1]) / (3 * h) 41 b = (a[1:] - a[:-1]) / h - h / 3 * (2 * c[:-1] + c[1:]) 42 a = a[:-1] 43 c = c[:-1] 44 return [a, b, c, d] 45 46 47# 三次関数の係数から, 元の点から間の点を求める。 48def calculateInterpolationPoints(splineParameter, 49 interpolationPointsNumber=1000): 50 a, b, c, d = splineParameter 51 assert (a.size == b.size == c.size == d.size) 52 index = np.repeat(np.arange(a.size), interpolationPointsNumber, axis=0) 53 t = np.tile(np.linspace(0, 1, interpolationPointsNumber), a.size) 54 return a[index] + b[index] * t + c[index] * t**2 + d[index] * t**3 55 56 57# 補間したい点の座標 58x = np.random.rand(100) 59y = np.random.rand(x.size) 60x = np.insert(x, x.size, x[0]) 61y = np.insert(y, y.size, y[0]) 62 63parameterX = calculatePeriodicSplineParameter(x) 64parameterY = calculatePeriodicSplineParameter(y) 65 66X = calculateInterpolationPoints(parameterX) 67Y = calculateInterpolationPoints(parameterY) 68 69plt.plot(X, Y, label="spline curve") 70plt.plot(x, y, marker='o', linestyle='None', label='original points') 71plt.legend() 72plt.savefig("graph.png", dpi=200, figsize=(4, 3)) 73
投稿2020/07/25 15:45
編集2020/07/26 07:05総合スコア698
バッドをするには、ログインかつ
こちらの条件を満たす必要があります。
0
予定ではクリックで点を生成し,その点をふやしていくことを考えています.
上記を実現するため、クラスを使って以前の状態を保持しておく例です。
なお、点の追加において、x値`は単純増加で与える(制御点が左側にぐるっと戻らない)ことが前提です。
Python
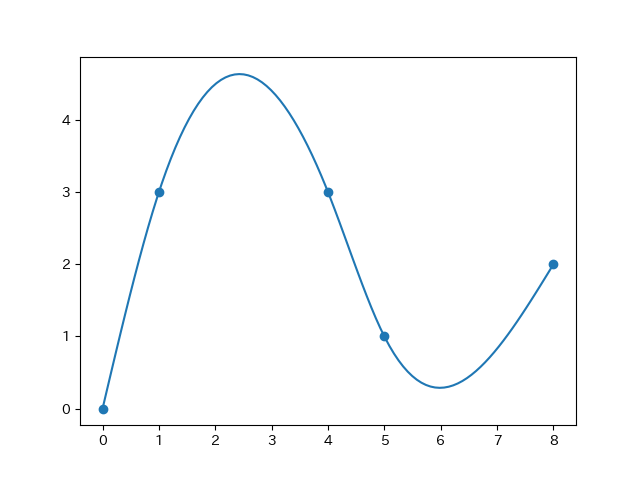
1import numpy as np 2import matplotlib.pyplot as plt 3 4# 3次スプライン補間法 5# http://www.civil.kumamoto-u.ac.jp/matsu/spline.pdf 6 7class Spline: 8 # xys : 最低3点ある配列 9 def __init__(self, xys): 10 self.xys = np.array(xys) 11 N = self.xys.shape[0] 12 assert N >= 3 13 14 self.h = np.array([self.xys[i,0]-self.xys[i-1,0] for i in range(1,N)]) 15 self.a = self.xys[:,1] 16 17 self.A = np.eye(N) 18 for i in range(2,N): 19 self.A[i-1,i-2:i+1] = self.get_A_line(i) 20 21 self.r = np.zeros(N) 22 for i in range(2,N): 23 self.r[i-1] = self.get_r_val(i) 24 25 # 指定行のAの値を計算して返す 26 def get_A_line(self, i): 27 return [self.h[i-2], 2*(self.h[i-2]+self.h[i-1]), self.h[i-1]] 28 29 # 指定位置のrの値を計算して返す 30 def get_r_val(self, i): 31 return 3*(self.a[i]-self.a[i-1])/self.h[i-1] - 3*(self.a[i-1]-self.a[i-2])/self.h[i-2] 32 33 # 新たな点を追加 34 def add(self,xy): 35 self.xys = np.vstack([self.xys, np.array(xy)]) 36 N = self.xys.shape[0] 37 self.h = np.append(self.h, self.xys[N-1,0]-self.xys[N-2,0]) 38 self.a = self.xys[:,1] 39 40 Anew = np.zeros((N,N)) 41 Anew[0:N-1,0:N-1] = self.A 42 self.A = Anew 43 self.A[N-2,N-3:N] = self.get_A_line(N-1) 44 self.A[N-1,N-1] = 1 45 46 self.r = np.append(self.r, 0) 47 self.r[N-2] = self.get_r_val(N-1) 48 49 # パラメータを算出 50 def calc_param(self): 51 Ainv = np.linalg.inv(self.A) 52 self.c = np.dot(Ainv, self.r) 53 N = self.xys.shape[0] 54 self.b = np.array([ (self.a[i]-self.a[i-1])/self.h[i-1] - self.h[i-1]/3*(2*self.c[i-1]+self.c[i]) for i in range(1,N)]) 55 self.d = np.array([ (self.c[i]-self.c[i-1])/(3*self.h[i-1]) for i in range(1,N)]) 56 57 # 補間されたy値を返す 58 def get_y(self, x): 59 xs = self.xys[:,0] 60 if x < xs[0] or x > xs[-1]: 61 return 0 62 elif x == self.xys[0,1]: 63 return xs[0] 64 elif x == xs[-1]: 65 return self.xys[-1,1] 66 67 # 区間を決定 68 i = 0 69 while True: 70 if xs[i] > x: 71 break 72 i += 1 73 i -= 1 74 75 dx = (x-xs[i]) 76 return self.a[i] + self.b[i]*dx + self.c[i]*dx*dx + self.d[i]*dx*dx*dx 77 78 79sp = Spline([[0,0],[1,3],[4,3]]) # 初期の3点は最初に与える 80sp.add([5,1]) 81sp.add([8,2]) 82sp.calc_param() 83 84print(sp.r)# [ 0. -9. -6. 7. 0.] 85print(sp.a)# [0 3 3 1 2] 86print(sp.b)# [ 3.31018519 2.37962963 -1.96759259 -1.5462963 ] 87print(sp.c)# [ 0. -0.93055556 -0.51851852 0.93981481 0. ] 88print(sp.d)# [-0.31018519 0.04578189 0.48611111 -0.10442387] 89 90# 描画 91xs = np.linspace( np.min(sp.xys[:,0]), np.max(sp.xys[:,0]), 100) 92ys = np.array([sp.get_y(x) for x in xs]) 93plt.scatter(sp.xys[:,0], sp.xys[:,1]) 94plt.plot(xs, ys) 95plt.show()
投稿2020/07/24 04:23
総合スコア38345
バッドをするには、ログインかつ
こちらの条件を満たす必要があります。
あなたの回答
tips
太字
斜体
打ち消し線
見出し
引用テキストの挿入
コードの挿入
リンクの挿入
リストの挿入
番号リストの挿入
表の挿入
水平線の挿入
プレビュー
質問の解決につながる回答をしましょう。 サンプルコードなど、より具体的な説明があると質問者の理解の助けになります。 また、読む側のことを考えた、分かりやすい文章を心がけましょう。


