
* Ampをプロットしてください
* [0:10]という謎範囲じゃなくてとりあえず全部プロットしてください
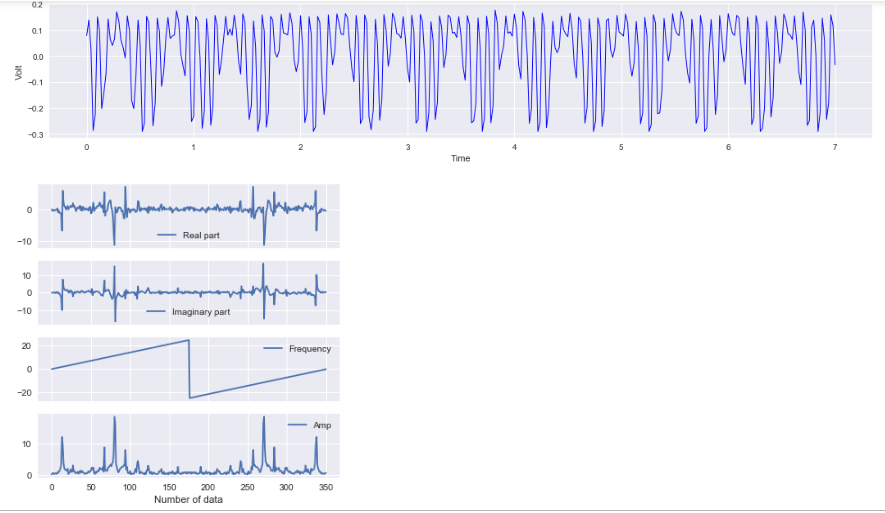
電圧と時間のデータからFFTで周波数を推定したい
電圧と時間のデータ(下のリンク参照)を元にフーリエ変換をして周波数を推定したいです
Jupyter notebookでfftを行ったところ、下の2つ目のの結果になってしまい、0のところに最大値が出てしまいます。
電圧と時間の関係のは1つめのグラフで、これを見る限りでは2Hz辺りにピークが来そうなのですが、予想通りになりません。
コードに問題があると思うのですが、自分で考えた限りでは分からなかったので教えていただきたいです。
test.ipynb
1 2test_data = pd.read_csv("CSVファイルへのパス") 3x = test_data["time"] 4y = test_data["volt"] 5N = len(y) 6dt = x[1]-x[0] 7 8t = np.arange(0,N*dt,dt) 9Y = np.array(y) 10 11F = np.fft.fft(Y) 12Amp = np.abs(F) 13freq = np.fft.fftfreq(N,d=dt) 14 15#PLot 16plt.figure(figsize=(18,3),facecolor="white") 17plt.plot(x,y,'b-', linewidth=1) 18plt.xlabel('Time') 19plt.ylabel('Volt') 20plt.grid(True) 21 22#FFT graph 23fig, ax = plt.subplots(nrows=4, sharex=True, figsize=(6,6)) 24ax[0].plot(F.real, label="Real part") 25ax[0].legend() 26ax[1].plot(F.imag, label="Imaginary part") 27ax[1].legend() 28ax[2].plot(freq, label="Frequency") 29ax[2].legend() 30ax[3].plot(Amp, label="Amp") 31ax[3].legend() 32ax[3].set_xlabel("Number of data") 33plt.show() 34

DC成分を引いた場合
remove_dc.ipynb
1test_data_middle = pd.read_csv("CSVファイルへのパス") 2x = test_data_middle["time"] 3y = test_data_middle["volt"] 4N = len(y) 5dt = x[1]-x[0] 6 7t = np.arange(0,N*dt,dt) 8#DCを削除する為に元データの平均を引く 9Y = np.array(y) 10Y_block_offset = Y - Y.mean() 11 12 13F = np.fft.fft(Y_block_offset) 14Amp = np.abs(F) 15freq = np.fft.fftfreq(N,d=dt) 16 17#PLot 18plt.figure(figsize=(18,3),facecolor="white") 19plt.plot(x,Y_block_offset,'b-', linewidth=1) 20plt.xlabel('Time') 21plt.ylabel('Volt') 22plt.grid(True) 23 24#FFT graph 25fig, ax = plt.subplots(nrows=4, sharex=True, figsize=(6,6)) 26ax[0].plot(F.real[0:20], label="Real part") 27ax[0].legend() 28ax[1].plot(F.imag[0:20], label="Imaginary part") 29ax[1].legend() 30ax[2].plot(freq[0:20], label="Frequency") 31ax[2].legend() 32ax[3].plot(Amp[0:20], label="Amp") 33ax[3].legend() 34ax[3].set_xlabel("Number of data") 35 36plt.show()
###結果
回答1件
あなたの回答
tips
プレビュー


