
month, sale, cost, benefit の変数を print して値がどうなっているか見てみてはどうでしょうか?
前提・実現したいこと
Python(Flask,Matplotlib)で、アップロードされたExcelファイルを基にグラフを作成したい
①WebページからExcelテンプレートファイルをダウンロード


②値を入力したExcelファイルを選択し、送信


③uploadsディレクトリに格納される

④アップロードされたExcelファイルを元にグラフを作成
①~③は問題なく動作しています。
④は完成イメージです。
エラーメッセージ・該当のソースコード
Python
1 if request.method == 'POST': 2 file = request.files['file'] 3 UPLOAD_FOLDER = r'C:\xxx\xxx\xxx\TestProject\uploads' 4 app.config['UPLOAD_FOLDER'] = UPLOAD_FOLDER 5 if file: 6 filename = secure_filename(file.filename) 7 file.save(os.path.join(app.config['UPLOAD_FOLDER'], filename)) 8 wb = xlrd.open_workbook(r"C:\xxx\xxx\xxx\TestProject\uploads\test.xlsx") 9 sheets = wb.sheets() 10 month = np.array(sheets['Sheet1'].cell(row=i, column=0).value for i in range(1, 13)) 11 sale = np.array(sheets['Sheet1'].cell(row=i, column=1).value for i in range(1, 13)) 12 cost = np.array(sheets['Sheet1'].cell(row=i, column=2).value for i in range(1, 13)) 13 benefit = sale - cost 14 #プロットの処理が続く 15
エラー例①
Python
1 sheets = wb.sheets() 2 month = np.array([sheets['Sheet1'].cell(row=i, column=0).value for i in range(1, 13)]) 3 sale = np.array([sheets['Sheet1'].cell(row=i, column=1).value for i in range(1, 13)]) 4 cost = np.array([sheets['Sheet1'].cell(row=i, column=2).value for i in range(1, 13)]) 5 benefit = sale - cost 6 plt.plot(month, sale) 7 plt.plot(month, cost) 8 plt.plot(month, benefit) 9 10 # month行でエラー 11→ TypeError: list indices must be integers or slices, not str
エラー例②
Python
1 sheets = wb.sheets() 2 month = np.array(sheets['Sheet1'].cell(row=i, column=0).value for i in range(1, 13)) 3 sale = np.array(sheets['Sheet1'].cell(row=i, column=1).value for i in range(1, 13)) 4 cost = np.array(sheets['Sheet1'].cell(row=i, column=2).value for i in range(1, 13)) 5 benefit = sale - cost 6 plt.plot(month, sale) 7 plt.plot(month, cost) 8 plt.plot(month, benefit) 9 10 #benefit行でエラー 11→ TypeError: unsupported operand type(s) for -: 'generator' and 'generator'
試したこと
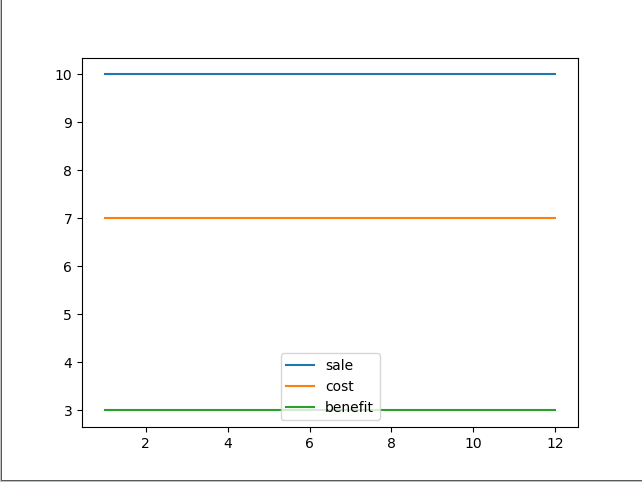
下記のコードは、正しく動作し冒頭にある④のグラフが作成されます
Python
1w = np.array([1, 2, 3, 4, 5, 6, 7, 8, 9, 10, 11, 12]) 2x = np.array([10, 10, 10, 10, 10, 10, 10, 10, 10, 10, 10, 10]) 3y = np.array([7, 7, 7, 7, 7, 7, 7, 7, 7, 7, 7, 7]) 4z = x - y 5 6plt.plot(w, x, label='sale') 7plt.plot(w, y, label='cost') 8plt.plot(w, z, label='benefit')
環境
開発環境:PyCharm
サーバ :localhost
ブラウザ:Chrome
month初期化の次行にprint("abc")print(month)を追加しましたが、何も表示されませんでした。アップロードされたExcelファイルの読み込みが間違っているのでしょうか。
そうですね。matplotlib の関数の使い方は問題なさそうなので、与えるデータに原因がありそうです。print(month) でなにも表示されないのはおかしいかと思います。month 以外にも sale, cost, benefit もちゃんと値が取れているのか確認したほうがよいですね。
sale, cost, benefitも同様の結果になりました。ファイルをアップロードさせる処理が今回初の試みであり、アップロードされたファイルの読み込みはエラーがでないように書き直しを繰り返したのでその点がうまくいってないのでしょうか。(エラーメッセージ・該当のソースコードにファイル読み込みのソースを追加しました)
wb = xlrd.open_workbook() で開いた Excel ファイルを直接 Excel で開いたら、ちゃんと中身が入っているか確認してみてはどうでしょうか?入っていれば、次は xlrd で値を取り出すところに問題があるということになるので、そのように問題を切り分けていきましょう。
局所化して考えるというアドバイスにより問題が解決されました。ありがとうございました。
回答1件
あなたの回答
tips
プレビュー


