前提・実現したいこと
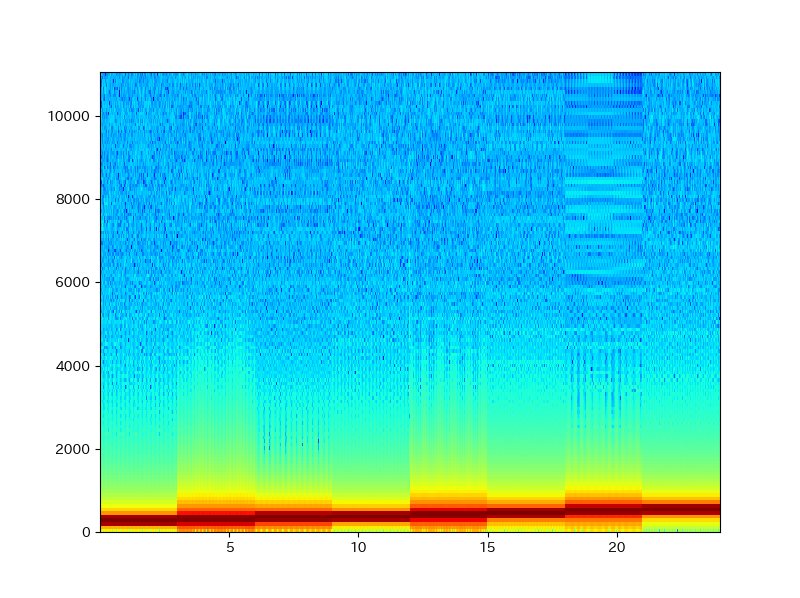
yに入れた信号をスペクトログラムで表示させたいのですが、
最後の行で下のようなエラーが出てしまいます。
どのようにしたら問題なくスペクトログラムを表示させられるでしょうか?
教えてください!
発生している問題・エラーメッセージ
Traceback (most recent call last):
  File "ans1.py", line 43, in <module>
    Sxx, f, t, im = plt.specgram(y, cmap='jet')
  File "/usr/local/lib/python3.6/dist-packages/matplotlib/pyplot.py", line 2845, in specgram
    is not None else {}), **kwargs)
  File "/usr/local/lib/python3.6/dist-packages/matplotlib/__init__.py", line 1565, in inner
    return func(ax, *map(sanitize_sequence, args), **kwargs)
  File "/usr/local/lib/python3.6/dist-packages/matplotlib/axes/_axes.py", line 7602, in specgram
    pad_xextent = (NFFT-noverlap) / Fs / 2
TypeError: unsupported operand type(s) for /: 'int' and 'NoneType'
該当のソースコード
# -*- coding: utf-8 -*-

import numpy as np
from scipy.io.wavfile import write
import matplotlib.pyplot as plt

Amp = 1.0

def GenFreq(Fc, Fs, dur):
    # 長さ dur 秒間,周波数 Fc[Hz] のデータを
    # サンプリング周波数 Fs[Hz] で生成する.
    # 正弦波関数を用いる
    # この関数を実装しなさい.(定義は変えてもOK)
    delta = 1./Fs  # サンプリング間隔
    Nmax = Fs * dur   # サンプル点の数
    t = np.arange(Nmax) * delta
    x = Amp * np.sin(2. * np.pi * Fc * t)
    x *= 32767              # windows標準のプレイヤーで再生できなかったので追加
    x = x.astype(np.int16)  # windows標準のプレイヤーで再生できなかったので追加
    return x


# 以下に GenFreq を用いて "CDEFGAB" の音階を各 dur 秒間
# 生成するスクリプトコードを書く

Fs = 22100.        # サンプリング周波数
Fcs = (262, 294, 330, 349, 392, 440, 494, 523)

y = GenFreq(Fcs[0], Fs, 3)

for i in [1,2,3,4,5,6,7]:
    y = np.append(y, GenFreq(Fcs[i], Fs, 3))


# y に音声波形を入れたものとしてファイルを保存
fname = 'MkSnd4Test.wav'
write(fname, int(Fs), y)


#スペクトログラムで確認
Sxx, f, t, im = plt.specgram(y, cmap='jet')

plt.figure(figsize=(8,6))
plt.pcolormesh(t, f, np.log(Sxx), cmap='jet')
plt.xlim(0, 2.0e5)
試したこと
調べたところplt.specgramというのがあったので使用してみました。
補足情報(FW/ツールのバージョンなど)
実行環境はGoogle Colabです。
回答1件
あなたの回答
tips
プレビュー


退会済みユーザー
2020/07/19 03:58
2020/07/19 04:01
退会済みユーザー
2020/07/19 04:20
2020/07/19 04:24
退会済みユーザー
2020/07/19 04:42
2020/07/19 05:01
退会済みユーザー
2020/07/19 05:37