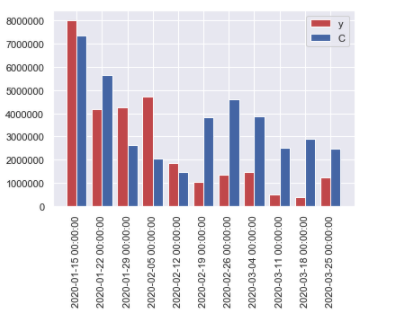
x軸に関してですが、x が pandas.DatetimeIndex型なのだとしたら、
の部分を
とすると良いのではないでしょうか。
(y軸に関しては、掲載されたコード、グラフの図から現象が確認できませんでした。)
Python
1import pandas as pd
2import numpy as np
3import matplotlib.pyplot as plt
4
5# 質問にデータが提示されていないので適当に作成
6N = 10
7x = pd.date_range('2020/1/1 0:00', periods=N, freq='1d')
8y = np.random.randint(10,100,N) * 1000
9y2 = np.random.randint(10,100,N) * 1000
10left = np.arange(N)
11
12# 以下は質問に掲載されたコード
13height1 = y
14height2 = y2
15labels = x.date
16
17width = 0.4
18plt.xticks(x, rotation=90)
19
20plt.bar(left, height1, color='r', width=width, align='center',label='y')
21plt.bar(left+width, height2, color='b', width=width, align='center',label='C')
22plt.legend(loc = 'upper right')
23plt.xticks(left + width/2, labels)
24plt.tight_layout()
25plt.show()

【追記】
Y軸の値に3桁区切りをつけるには、(もう一つの質問で回答した)FuncFormatter() で変換するのが簡単です。
Python
1plt.gca().get_yaxis().set_major_formatter(ticker.FuncFormatter(lambda v,p: f'{int(v):,d}'))
修正済みサンプルコード
import pandas as pd
import numpy as np
import matplotlib.pyplot as plt
import matplotlib.ticker as ticker

N = 10
x = pd.date_range('2020/1/1 0:00', periods=N, freq='1d')
y = np.random.randint(10,100,N) * 1000
y2 = np.random.randint(10,100,N) * 1000
left = np.arange(N)

height1 = y
height2 = y2
labels = x.date

width = 0.4
plt.xticks(x, rotation=90)

plt.bar(left, height1, color='r', width=width, align='center',label='y')
plt.bar(left+width, height2, color='b', width=width, align='center',label='C')
plt.legend(loc = 'upper right')
plt.xticks(left + width/2, labels)
plt.gca().get_yaxis().set_major_formatter(ticker.FuncFormatter(lambda v,p: f'{int(v):,d}'))
plt.tight_layout()
plt.show()


バッドをするには、ログインかつ
こちらの条件を満たす必要があります。
2020/04/04 06:20
2020/04/04 08:33
2020/04/04 09:00
2020/04/04 13:19
2020/04/04 13:19