前提・実現したいこと
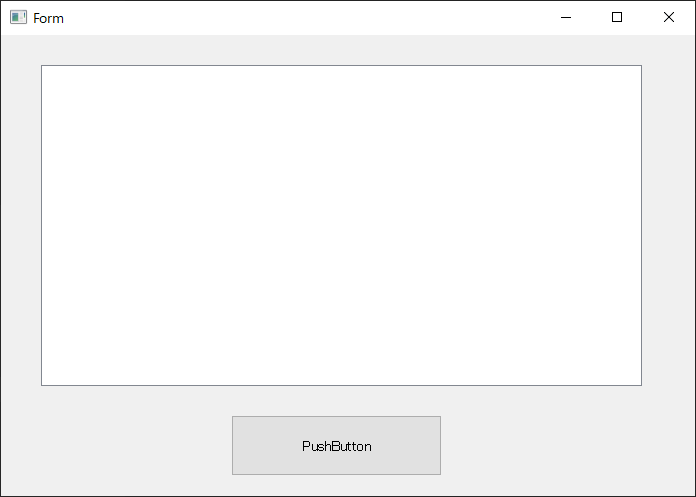
図のようなGUIを作成する為、Qt DesignerにGraphicsViewを配置し、
PushButtonボタンを押下後、GraphicsViewに、pyqtgraphを用いてグラフを表示させたいです。
リアルタイムでも表示させたく、matplotlibではグラフの描画に時間が掛かる為、pyqtgraph を用いています。
QTデザイナ(QT Designer)でpyqtgraphオブジェクトを扱う方法 を参考にしました。
リンク内容
発生している問題・エラーメッセージ
上記サイトを参考にして試みていますが、操作方法が分かりません。
該当のソースコード
Qt Designerで作成した uiファイル
QtDesigner
1<?xml version="1.0" encoding="UTF-8"?> 2<ui version="4.0"> 3 <class>Form</class> 4 <widget class="QWidget" name="Form"> 5 <property name="geometry"> 6 <rect> 7 <x>0</x> 8 <y>0</y> 9 <width>694</width> 10 <height>461</height> 11 </rect> 12 </property> 13 <property name="windowTitle"> 14 <string>Form</string> 15 </property> 16 <widget class="QGraphicsView" name="graphicsView"> 17 <property name="geometry"> 18 <rect> 19 <x>40</x> 20 <y>30</y> 21 <width>601</width> 22 <height>321</height> 23 </rect> 24 </property> 25 </widget> 26 <widget class="QPushButton" name="pushButton"> 27 <property name="geometry"> 28 <rect> 29 <x>230</x> 30 <y>380</y> 31 <width>211</width> 32 <height>61</height> 33 </rect> 34 </property> 35 <property name="text"> 36 <string>PushButton</string> 37 </property> 38 </widget> 39 </widget> 40 <resources/> 41 <connections> 42 <connection> 43 <sender>pushButton</sender> 44 <signal>clicked()</signal> 45 <receiver>Form</receiver> 46 <slot>myFunc()</slot> 47 <hints> 48 <hint type="sourcelabel"> 49 <x>421</x> 50 <y>415</y> 51 </hint> 52 <hint type="destinationlabel"> 53 <x>521</x> 54 <y>395</y> 55 </hint> 56 </hints> 57 </connection> 58 </connections> 59 <slots> 60 <slot>myFunc()</slot> 61 </slots> 62</ui>
作成したuiファイルを.pyに変換 ( pyuic5 .\GUI_Test.ui -x -o .\GUI_Test.py )
Python
1# -*- coding: utf-8 -*- 2 3# Form implementation generated from reading ui file '.\GUI_Test.ui' 4# 5# Created by: PyQt5 UI code generator 5.12.2 6# 7# WARNING! All changes made in this file will be lost! 8 9from PyQt5 import QtCore, QtGui, QtWidgets 10 11 12class Ui_Form(object): 13 def setupUi(self, Form): 14 Form.setObjectName("Form") 15 Form.resize(694, 461) 16 self.graphicsView = QtWidgets.QGraphicsView(Form) 17 self.graphicsView.setGeometry(QtCore.QRect(40, 30, 601, 321)) 18 self.graphicsView.setObjectName("graphicsView") 19 self.pushButton = QtWidgets.QPushButton(Form) 20 self.pushButton.setGeometry(QtCore.QRect(230, 380, 211, 61)) 21 self.pushButton.setObjectName("pushButton") 22 23 self.retranslateUi(Form) 24 self.pushButton.clicked.connect(Form.myFunc) 25 QtCore.QMetaObject.connectSlotsByName(Form) 26 27 def retranslateUi(self, Form): 28 _translate = QtCore.QCoreApplication.translate 29 Form.setWindowTitle(_translate("Form", "Form")) 30 self.pushButton.setText(_translate("Form", "PushButton")) 31 32if __name__ == "__main__": 33 import sys 34 app = QtWidgets.QApplication(sys.argv) 35 Form = QtWidgets.QWidget() 36 ui = Ui_Form() 37 ui.setupUi(Form) 38 Form.show() 39 sys.exit(app.exec_())
GUIの起動
Python
1import os 2import sys 3 4from PyQt5 import QtCore as QC 5from PyQt5 import QtGui as Qg 6from PyQt5 import QtWidgets as Qw 7 8import pyqtgraph as pg 9 10import GUI_Test 11 12class MyForm(Qw.QMainWindow): 13 def __init__(self, parent=None): 14 super().__init__(parent) 15 self.ui = GUI_Test.Ui_Form() 16 self.ui.setupUi(self) 17 18 def myFunc(self): 19 print('トライアルとして、以下のデータを pyqtgraph で波形を表示させたい') 20 x = [1,2,3,4,5] 21 y = [11,12,13,14,15] 22 23if __name__ == "__main__": 24 app = Qw.QApplication(sys.argv) 25 wmain = MyForm() 26 wmain.show() 27 app.exec_()
試したこと
以前に、こちらで同様の質問をさせて頂き、自己解決したつもりですが、pyqtgraph を用いておらず、
直接GraphicsViewにグラフを書き込んでいたようです。
行き詰まってしまい、再度質問させて頂きました。
大変お手数をお掛け致しますが、
アドバイスを頂けないでしょうか?
補足情報(FW/ツールのバージョンなど)
Windows10 64bit
Python3.6.8
PyQt5.12.2
pyqtgraph 0.10.0
回答1件
あなたの回答
tips
プレビュー


