


> 予測値がほとんど負の値で表示されてしまいます。
> 試行錯誤してみましたが、何が悪いのか全くわかりません。
何を「試行錯誤」されたのか教えてください。質問に追記お願いします。
実現したいこと
モデル(Lasso回帰)を用いて正しいボストン市の住宅価格の予測値を求めたい。
前提
ボストン市の住宅価格データセットを用いて、予測モデルを作ろうとしています。
複数のモデルの精度をRMSEで測定した結果、Lasso回帰が最も良かったので、
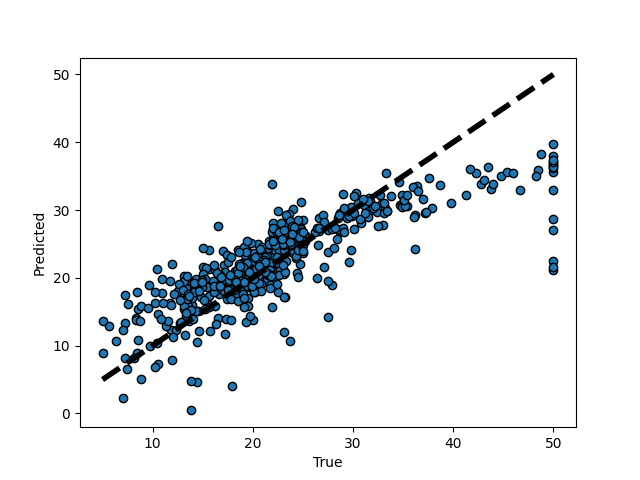
最後にLasso回帰を用いた住宅価格の予測値と正当値の関係を散布図で表示したいのですが、
予測値がほとんど負の値で表示されてしまいます。
試行錯誤してみましたが、何が悪いのか全くわかりません。
ご指摘いただければ幸いです。
よろしくお願いいたします。
該当のソースコード
python
1from sklearn import datasets 2data = datasets.load_boston() 3 4y=data.target # yにはMEDVが格納されています 5x=data.data # xにはMEDV以外の列が格納されています 6 7# 以下にコードを書いてください 8import matplotlib.pyplot as plt 9import numpy as np 10import pandas as pd 11import seaborn as sns 12import scipy.stats 13 14from sklearn.linear_model import LinearRegression, Lasso, Ridge, ElasticNet 15from sklearn.model_selection import train_test_split 16from sklearn.metrics import mean_squared_error 17from sklearn.preprocessing import StandardScaler 18 19# xとyをデータフレームにまとめる 20boston_df = pd.DataFrame(np.column_stack([x, y]), 21 columns=np.r_[data.feature_names, ['MEDV']]) 22 23# 相関関係の高い5つの変数を訓練用とテスト用に分割する 24x = boston_df[['LSTAT','RM','PTRATIO','INDUS']] 25y = boston_df[['MEDV']] 26x_train, x_test, y_train, y_test = train_test_split(x, y, test_size=0.2, random_state=0) 27 28# 標準化を行う 29scaler = StandardScaler() 30scaler.fit(x_train) 31x_train_scaled = scaler.transform(x_train) 32x_test_scaled = scaler.transform(x_test) 33 34# 予測精度の高いモデルを探す 35min_RMSE = 10 36best_model = '' 37best_mode_name = '' 38 39models = [ 40 LinearRegression(), 41 Lasso(), 42 Ridge(), 43 ElasticNet(l1_ratio=0.3) 44 ] 45 46for model in models : 47 model_name = model.__class__.__name__ 48 model.fit(x_train_scaled, y_train) 49 y_test_pred = model.predict(x_test_scaled) 50 RMSE = mean_squared_error(y_test, y_test_pred, squared=False) 51 print('{} : {}'.format(model_name, RMSE)) 52 if min_RMSE > RMSE: 53 min_RMSE = RMSE 54 best_model = model 55 best_model_name = model_name 56 57print('ベストモデル名 :', best_model_name) 58print('最小二乗平均平方根誤差 :', min_RMSE) 59 60#グラフの描画 61y_pred = best_model.predict(x) 62fig, ax = plt.subplots() 63ax.scatter(y, y_pred, edgecolors=(0, 0, 0)) 64ax.plot([y.min(), y.max()], [y.min(), y.max()], 'k--', lw=4) 65ax.set_xlabel('True') 66ax.set_ylabel('Predicted') 67plt.show()
散布図
60〜67行目の表示

コメントありがとうございます。
多分、的外れなことをしているのだろうなと思い、試行錯誤の内容をあえて書きませんでした。
申し訳ありません。
やったこととしては、標準化のコードを消してみたり、説明変数を4つに絞るのではなく13個全て使ってみたりしました。
別の方が回答くださったように、予測値を求める際に標準化されたデータを用いる必要があったのですね。
勉強不足でした。
また何かありましたらよろしくお願いいたします。
回答1件
あなたの回答
tips
プレビュー


