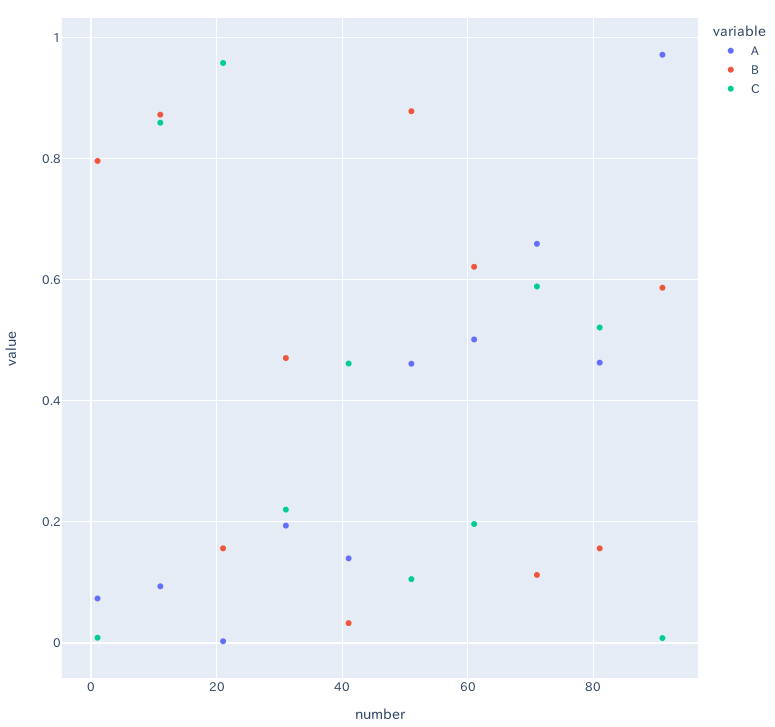
このようなデータフレームから x の値に number の 1,11,21,31,41,51,61,71,81,91 をとり、
pandas.Series.isin — pandas 1.3.4 documentation を使うことができます。
python
1from numpy.random import default_rng
2import pandas as pd
3
4pd.options.display.float_format="{:.1f}".format
5
6N = 1000
7rg = default_rng()
8df = pd.DataFrame({
9 'number': range(1, N+1),
10 'A': rg.uniform(0, 1.0, N),
11 'B': rg.uniform(0, 1.0, N),
12 'C': rg.uniform(0, 1.0, N),
13})
14
15df_isin = df[df['number'].isin(range(1, 92, 10))]
16
17plot = df_isin.plot(
18 kind='scatter', x='number', y=df.columns[1:].tolist(), backend='plotly',
19 width=800, height=800
20)
21
22plot.show()
python
1## print(df)
2
3 number A B C
40 1 0.7 0.3 0.3
51 2 0.1 0.3 0.4
62 3 1.0 0.9 0.1
73 4 0.2 0.7 0.1
84 5 0.6 0.6 0.2
9.. ... .. .. ..
10995 996 0.1 0.5 0.9
11996 997 1.0 0.7 0.8
12997 998 0.9 0.8 0.6
13998 999 0.5 0.7 0.4
14999 1000 0.5 0.9 0.2
15
16[1000 rows x 4 columns]
17
18## df_isin = df[df['number'].isin(range(1, 92, 10))]
19## print(df_isin)
20
21 number A B C
220 1 0.7 0.3 0.3
2310 11 0.5 0.9 0.6
2420 21 0.9 0.5 0.1
2530 31 0.8 0.5 0.3
2640 41 0.4 0.3 0.7
2750 51 0.4 0.0 0.1
2860 61 0.1 0.2 0.6
2970 71 0.1 0.1 0.5
3080 81 0.2 0.6 0.7
3190 91 0.4 0.6 0.7


