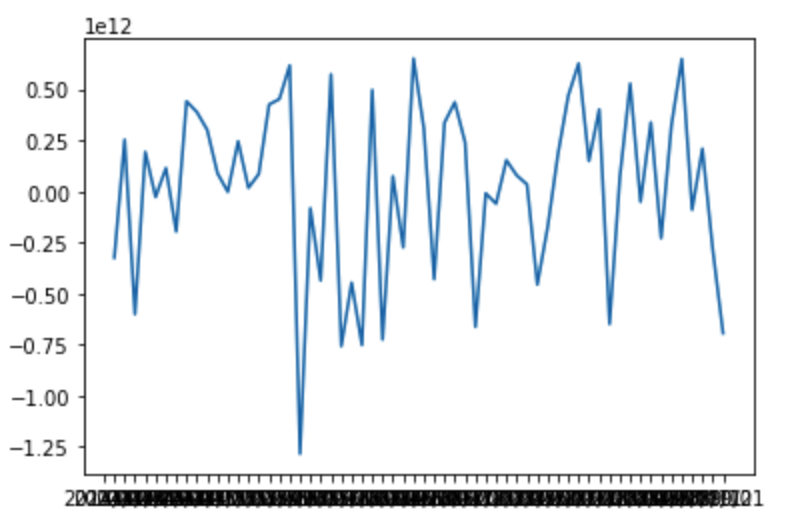
時系列分析のために原系列とその差分系列の自己相関、偏自己相関をプロットしたいのですが、差分系列の場合だけうまくいきません。
python3
1import numpy as np 2import statsmodels.api as sm 3import numpy as np 4import pandas as pd 5import matplotlib.pyplot as plt 6#データの読み込み 7marketcap = pd.read_csv('stock_market_cap.csv', index_col=0) 8#a1(原系列)について調べる。 9a1 = marketcap['Asset1'] 10plt.plot(a1) 11fig = plt.figure(figsize=(12,8)) 12ax1 = fig.add_subplot(211) 13fig = sm.graphics.tsa.plot_acf(a1, lags=20,ax=ax1) 14ax2 = fig.add_subplot(212) 15fig = sm.graphics.tsa.plot_pacf(a1, lags=20, ax=ax2) 16#a2(差分系列)について調べる。 17a2 = a1 - a1.shift() 18plt.plot(a2) 19fig = plt.figure(figsize=(12,8)) 20ax1 = fig.add_subplot(211) 21fig = sm.graphics.tsa.plot_acf(a2, lags=20,ax=ax1) 22ax2 = fig.add_subplot(212) 23fig = sm.graphics.tsa.plot_pacf(a2, lags=20, ax=ax2)
原系列と差分系列およびそれらのコレログラムは以下のようになりました。
回答1件
あなたの回答
tips
プレビュー


バッドをするには、ログインかつ
こちらの条件を満たす必要があります。
2019/12/04 14:33