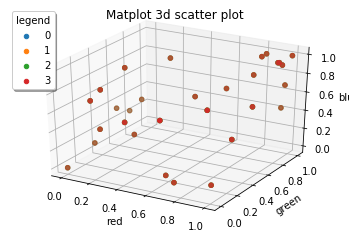
3種類のデータ、4種類のラベルで、120個のデータがあります。
これを三次元の散布図にしたいのですが、120個のデータのうち、最後の30個しかプロットされません。
データは、ラベル0が30個、1が30個、2が30個、3が30個の順です。
python
1import numpy as np 2import pandas as pd 3import matplotlib.pyplot as plt 4from mpl_toolkits.mplot3d import axes3d 5pd.options.display.max_rows = 8 6state = np.random.RandomState(0) 7# csv からデータ読み込み 8names = ['red', 'green', 'blue','season'] 9coloer = pd.read_csv('personal_coloer_data_rgb.csv', header=None, names=names) 10df=coloer 11label=df[['season']] 12data=df[['red', 'green', 'blue']] 13 14X=data 15T=label 16 17 18hue = 'season' 19labels = set(df[hue]) 20dataset = [] 21for x in labels: 22 xs = df[df[hue]==x]['red'] 23 ys = df[df[hue]==x]['green'] 24 zs = df[df[hue]==x]['blue'] 25 dataset.append((xs, ys, zs)) 26 27fig = plt.figure() 28 29ax = fig.add_subplot(1, 1, 1, projection='3d') 30for data, label in zip(dataset, labels): 31 ax.scatter(xs, ys, zs, label=label) 32ax.set_title('Matplot 3d scatter plot') # タイトル 33ax.set_xlabel('red') # X軸ラベル 34ax.set_ylabel('green') # Y軸ラベル 35ax.set_zlabel('blue') # Z軸ラベル 36ax.legend(loc=2, title='legend', shadow=True) # 凡例 37 38plt.show()
使っているデータは、
red green blue season
0 1 0.99 0.96 0
1 0.98 0.93 0.78 0
2 0.94 0.92 0.87 0
・
・
・
30 0.95 0.91 0.85 1
31 0.7 0.6 0.47 1
32 0.71 0.57 0.32 1
・
・
・
60 0.97 0.97 0.95 2
61 0.6 0.64 0.69 2
62 0.32 0.38 0.48 2
・
・
・
90 1 0.87 0.96 3
91 0.85 0.89 1 3
92 0.92 0.99 0.91 3
・
・
・
119 0.92 0.99 0.91 3
labelのseasonが0~3までそれぞれ30個ずつあります
回答1件
あなたの回答
tips
プレビュー


