回答編集履歴
2
モデルの変更.unitsの扱いミスの修正
answer
CHANGED
|
@@ -39,9 +39,7 @@
|
|
|
39
39
|
|
|
40
40
|
# モデル作成
|
|
41
41
|
inputs = Input(shape = (256, 6))
|
|
42
|
-
x = Reshape((6, 256))(inputs)
|
|
43
|
-
x = LSTM(
|
|
42
|
+
x = LSTM(32, return_sequences = True)(inputs)
|
|
44
|
-
x = Reshape((256, 6))(x)
|
|
45
43
|
x = Conv1D(1, 3, padding = "same", activation = "linear")(x)
|
|
46
44
|
model = Model(inputs, x)
|
|
47
45
|
|
|
@@ -71,6 +69,6 @@
|
|
|
71
69
|
plt.show()
|
|
72
70
|
```
|
|
73
71
|
|
|
74
|
-

|
|
75
73
|
|
|
76
74
|
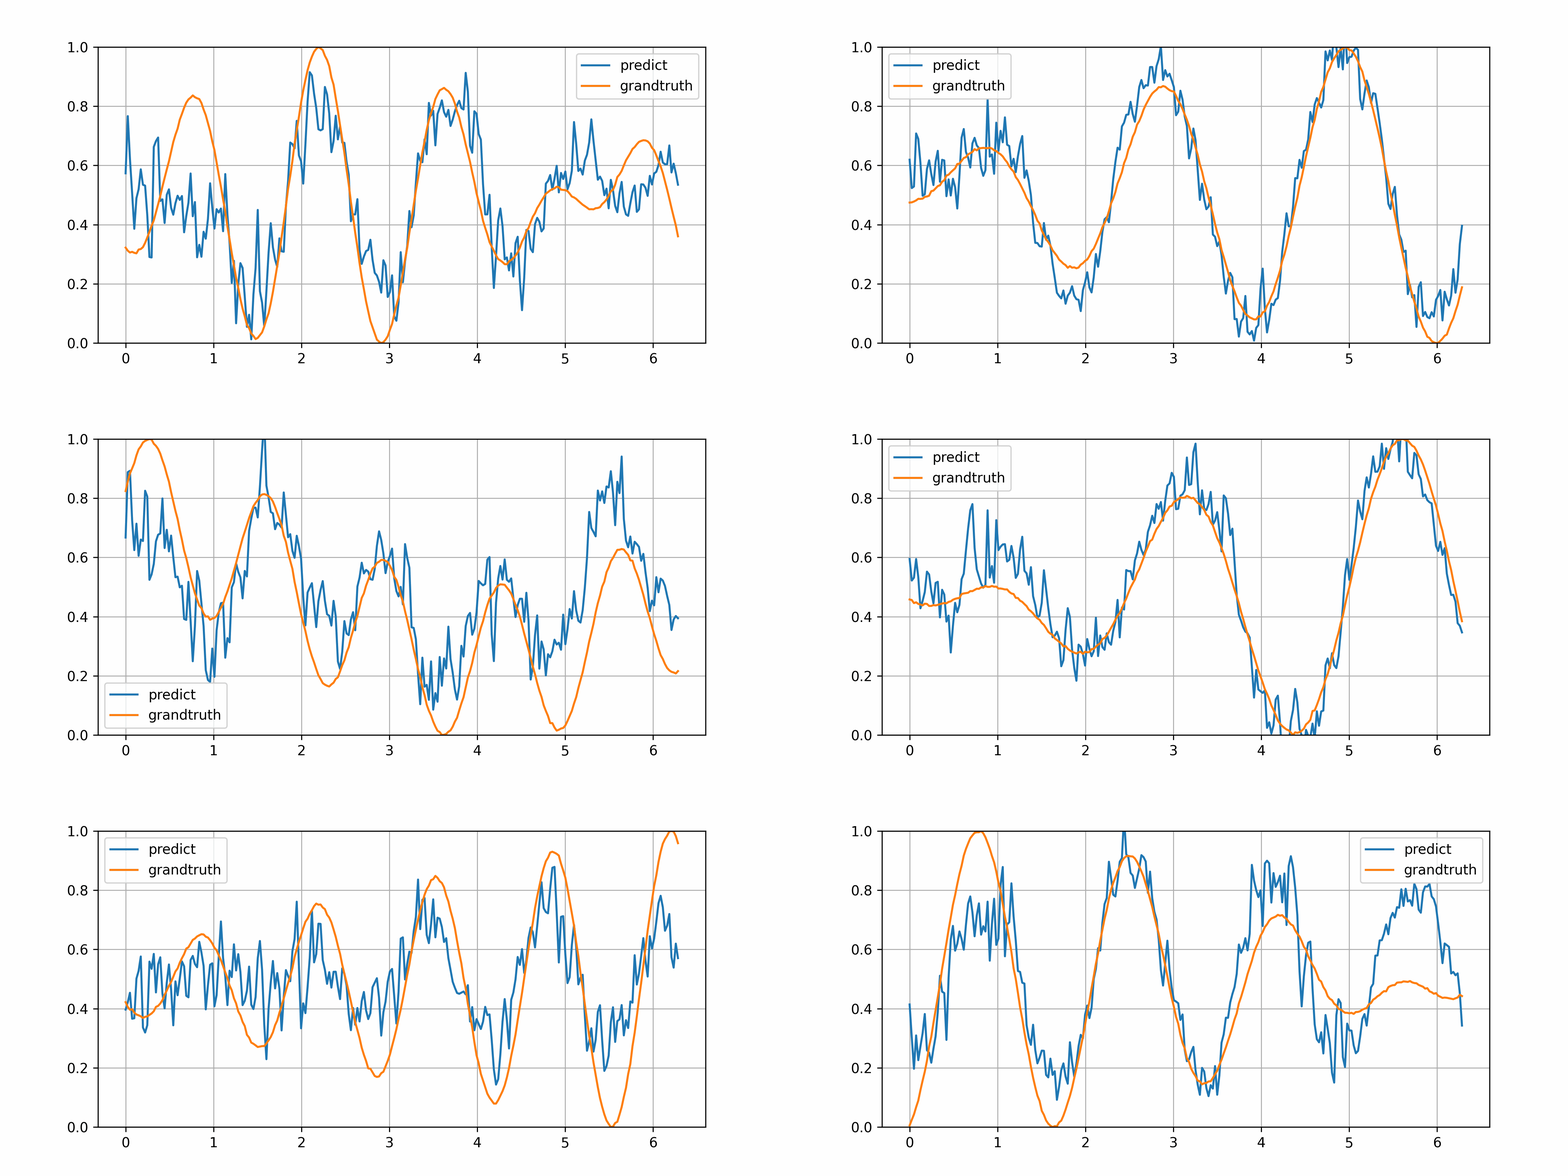
うまくフィットしない波形はあるものの,概ね説明変数から波形を予測できていることがわかります.実験した感じ,LSTMには予測したい時刻を必ず与える必要があるように感じました.
|
1
update code
answer
CHANGED
|
@@ -18,19 +18,19 @@
|
|
|
18
18
|
from tensorflow.python.keras.models import Model
|
|
19
19
|
|
|
20
20
|
# 擬似データ作成
|
|
21
|
-
def wave(
|
|
21
|
+
def wave(t, f1, p1, f2, p2, bias):
|
|
22
|
-
y = np.sin(
|
|
22
|
+
y = np.sin(f1 * t + p1) + np.cos(f2 * t + p2) + bias + np.random.randn(*t.shape) * 0.01
|
|
23
23
|
return (y - y.min()) / (y.max() - y.min())
|
|
24
24
|
|
|
25
25
|
def make_data():
|
|
26
26
|
x, y = list(), list()
|
|
27
27
|
for i in range(2 ** 14):
|
|
28
|
-
|
|
28
|
+
f1, f2 = np.random.randn(2) + np.pi
|
|
29
|
-
|
|
29
|
+
p1, p2 = np.random.randn(2) * np.pi
|
|
30
|
-
|
|
30
|
+
bias = (np.random.randn(1) + 0.1)[0]
|
|
31
31
|
t = np.linspace(0, 2 * np.pi, 256)
|
|
32
|
-
x.append([[
|
|
32
|
+
x.append([[_t, f1, p1, f2, p2, bias] for _t in t])
|
|
33
|
-
y.append(wave(t,
|
|
33
|
+
y.append(wave(t, f1, p1, f2, p2, bias))
|
|
34
34
|
return np.array(x), np.array(y)
|
|
35
35
|
|
|
36
36
|
# データ読み込み
|
|
@@ -61,14 +61,14 @@
|
|
|
61
61
|
# 結果の確認
|
|
62
62
|
pred = model.predict(x_valid)
|
|
63
63
|
for i in range(10):
|
|
64
|
-
t = x_valid[i][:,
|
|
64
|
+
t = x_valid[i][:, 0]
|
|
65
|
-
plt.figure(figsize = (8, 4)
|
|
65
|
+
plt.figure(figsize = (8, 4))
|
|
66
66
|
plt.plot(t, pred[i], label = "predict")
|
|
67
|
-
plt.plot(t, wave(
|
|
67
|
+
plt.plot(t, wave(t, *x_valid[i][0, 1:]), label = "grandtruth")
|
|
68
68
|
plt.ylim([0, 1])
|
|
69
69
|
plt.grid()
|
|
70
70
|
plt.legend()
|
|
71
|
-
plt.
|
|
71
|
+
plt.show()
|
|
72
72
|
```
|
|
73
73
|
|
|
74
74
|

|
