質問編集履歴
7
追加
title
CHANGED
|
File without changes
|
body
CHANGED
|
@@ -56,4 +56,6 @@
|
|
|
56
56
|
そもそもLatex表記を用いずにplotlyのような表記にしたいです。
|
|
57
57
|

|
|
58
58
|
|
|
59
|
+

|
|
60
|
+
|
|
59
61
|
### 補足
|
6
修正
title
CHANGED
|
File without changes
|
body
CHANGED
|
@@ -54,6 +54,6 @@
|
|
|
54
54
|
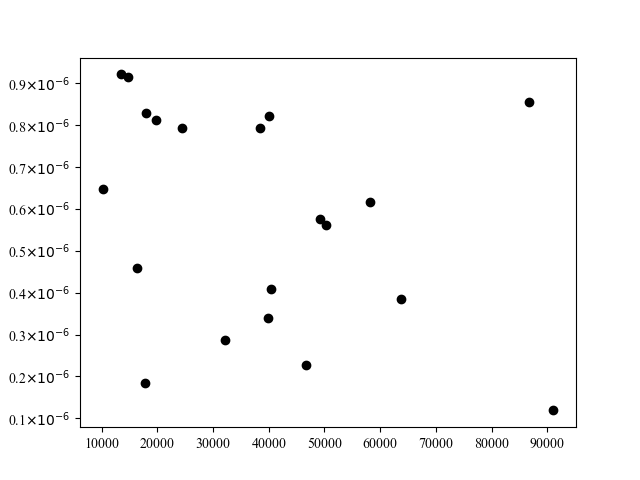
具体的にフォントが合わないというのは、plt.rcParams['font.family'] = 'Times New Roman'としても、以下のY軸のように「0.9」と「×10^-6」のフォントが合わないという事象です。
|
|
55
55
|
plt.rcParams['mathtext.fontset'] = 'stixsans'として少し見た目を寄せることも検討しましたが、やはり違和感が拭えません。
|
|
56
56
|
そもそもLatex表記を用いずにplotlyのような表記にしたいです。
|
|
57
|
-

|
|
58
58
|
|
|
59
59
|
### 補足
|
5
改善
title
CHANGED
|
File without changes
|
body
CHANGED
|
@@ -52,6 +52,8 @@
|
|
|
52
52
|
ax.yaxis.set_major_formatter(ticker.FuncFormatter(lambda y,_: f'{y*10:.1f}'+ r'$\times 10^{-1}$'))
|
|
53
53
|
を試したのですが、数字の部分のフォント(Times New Roman)と指数部分のLatex表記のフォントが合わせられず、断念しました。
|
|
54
54
|
具体的にフォントが合わないというのは、plt.rcParams['font.family'] = 'Times New Roman'としても、以下のY軸のように「0.9」と「×10^-6」のフォントが合わないという事象です。
|
|
55
|
+
plt.rcParams['mathtext.fontset'] = 'stixsans'として少し見た目を寄せることも検討しましたが、やはり違和感が拭えません。
|
|
56
|
+
そもそもLatex表記を用いずにplotlyのような表記にしたいです。
|
|
55
57
|

|
|
56
58
|
|
|
57
59
|
### 補足
|
4
改善
title
CHANGED
|
File without changes
|
body
CHANGED
|
@@ -51,6 +51,7 @@
|
|
|
51
51
|
の、
|
|
52
52
|
ax.yaxis.set_major_formatter(ticker.FuncFormatter(lambda y,_: f'{y*10:.1f}'+ r'$\times 10^{-1}$'))
|
|
53
53
|
を試したのですが、数字の部分のフォント(Times New Roman)と指数部分のLatex表記のフォントが合わせられず、断念しました。
|
|
54
|
+
具体的にフォントが合わないというのは、plt.rcParams['font.family'] = 'Times New Roman'としても、以下のY軸のように「0.9」と「×10^-6」のフォントが合わないという事象です。
|
|
55
|
+

|
|
54
56
|
|
|
55
57
|
### 補足
|
|
56
|
-
特になし
|
3
書式の改善
title
CHANGED
|
File without changes
|
body
CHANGED
|
@@ -16,12 +16,10 @@
|
|
|
16
16
|
|
|
17
17
|
|
|
18
18
|
### 別モジュールplotlyを用いたやり方
|
|
19
|
-
|
|
20
|
-
|
|
19
|
+
```
|
|
21
20
|
import random
|
|
22
21
|
import plotly.graph_objects as go
|
|
23
22
|
|
|
24
|
-
#テストデータの作成
|
|
25
23
|
random.seed(123)
|
|
26
24
|
X=[random.uniform(10000, 100000) for i in range(20)]
|
|
27
25
|
Y=[random.uniform(10000, 100000) for i in range(20)]
|
|
@@ -34,7 +32,6 @@
|
|
|
34
32
|
marker=dict(color='red', size=10),
|
|
35
33
|
))
|
|
36
34
|
|
|
37
|
-
# 背景,軸の色,グラフの大きさ
|
|
38
35
|
fig.update_layout(plot_bgcolor="white")
|
|
39
36
|
fig.update_xaxes(exponentformat="power", linecolor='black', gridcolor='gray',mirror=True)
|
|
40
37
|
fig.update_yaxes(exponentformat="power", linecolor='black', gridcolor='gray',mirror=True)
|
2
書式の改善
title
CHANGED
|
File without changes
|
body
CHANGED
|
@@ -15,9 +15,8 @@
|
|
|
15
15
|
|
|
16
16
|
|
|
17
17
|
|
|
18
|
-
###
|
|
18
|
+
### 別モジュールplotlyを用いたやり方
|
|
19
19
|
|
|
20
|
-
```別モジュールplotlyを用いたやり方
|
|
21
20
|
#ライブラリのインポート
|
|
22
21
|
import random
|
|
23
22
|
import plotly.graph_objects as go
|
1
誤字
title
CHANGED
|
File without changes
|
body
CHANGED
|
@@ -50,7 +50,9 @@
|
|
|
50
50
|
- [ ] その他
|
|
51
51
|
|
|
52
52
|
##### 上記の詳細・結果
|
|
53
|
+
調べて見つけた方法
|
|
53
|
-
|
|
54
|
+
https://qiita.com/code0327/items/d2f199c5e1267d4822fb
|
|
55
|
+
の、
|
|
54
56
|
ax.yaxis.set_major_formatter(ticker.FuncFormatter(lambda y,_: f'{y*10:.1f}'+ r'$\times 10^{-1}$'))
|
|
55
57
|
を試したのですが、数字の部分のフォント(Times New Roman)と指数部分のLatex表記のフォントが合わせられず、断念しました。
|
|
56
58
|
|
