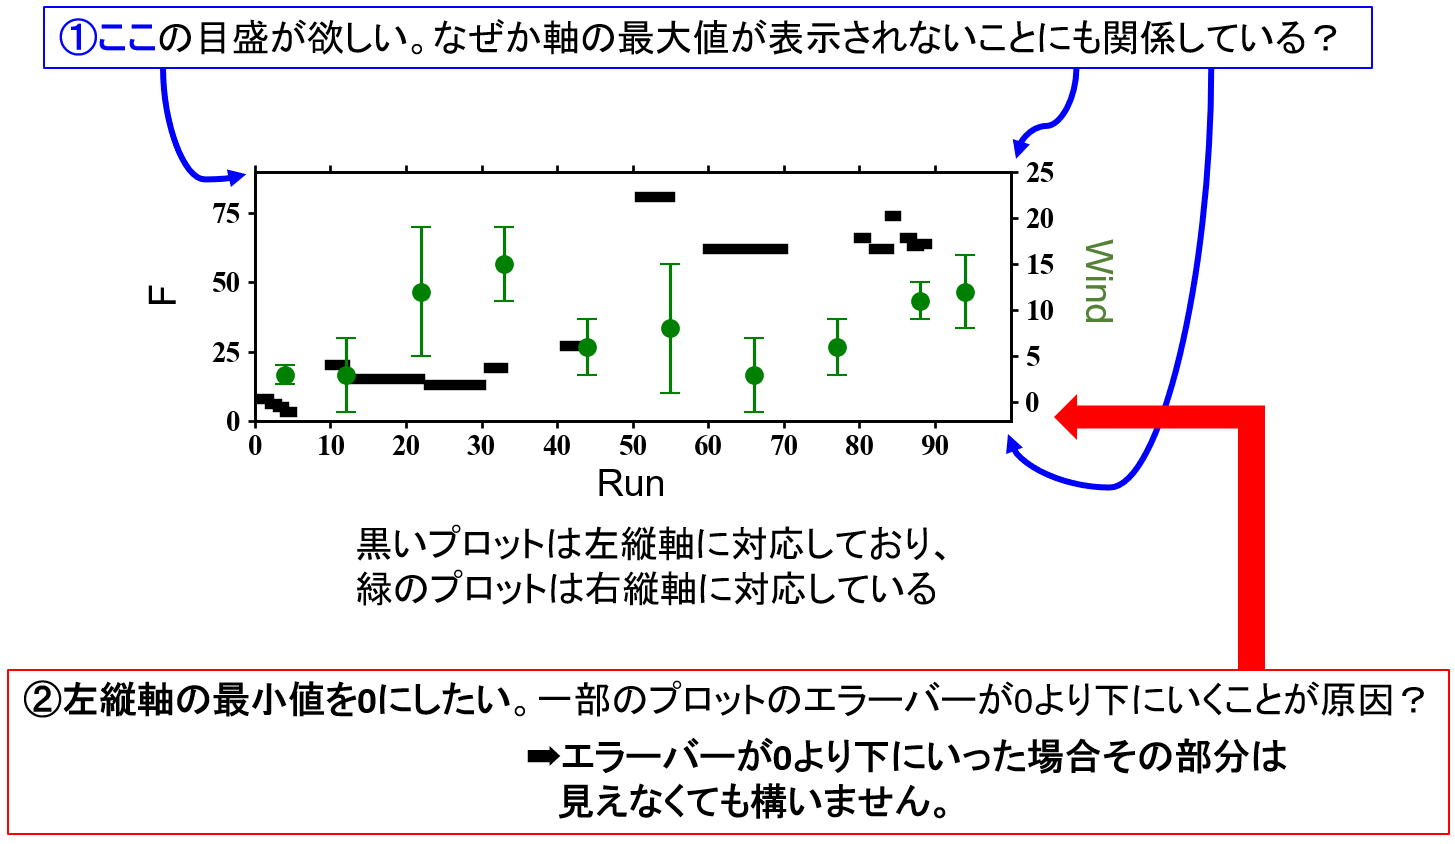
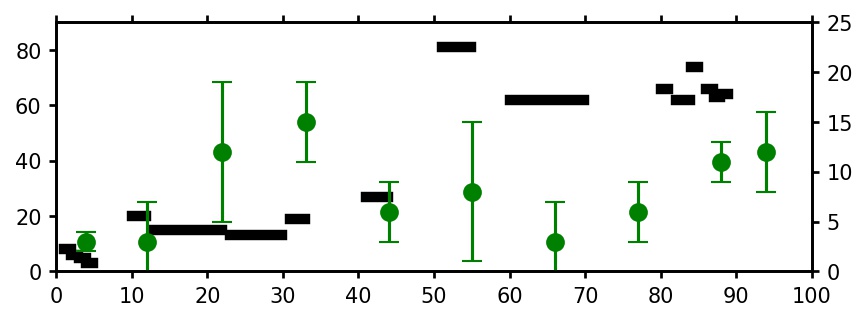
グラフで範囲指定が上手くできません。
(1)軸設定
まず、軸の最大値及び目盛が表示されないです。
例えば、図の下横軸を0から100までに設定しているのですが、"100"の数字とその目盛が描かれません。
(2)範囲指定
右縦軸の最小値を0にし、それ以下はグラフ内に表示したくないのですが、
エラーバーを設定したせいなのか上手くいきません(エラーバーの範囲が0を下回る点があるから?)。
どのように修正すればよいかご助言いただけると幸いです。
また、説明が不足している点があれば、ご指摘頂けると幸いです。
以下にコードとデータを記します。
python
1import matplotlib as mpl 2import matplotlib.pyplot as plt 3import numpy as np 4import pandas as pd 5import datetime 6import matplotlib.dates as mdates 7import openpyxl 8 9wb = openpyxl.load_workbook("RenSS.xlsx") 10ws = wb["Sheet1"] 11 12header_cells = ws[1] 13 14student_list = [] 15for row in ws.iter_rows(min_row=3): 16 row_dic = {} 17 for k, v in zip(header_cells, row): 18 row_dic[k.value] = v.value 19 student_list.append(row_dic) 20 21f = [] 22for student in student_list: 23 f.append(student["F"]) 24 25start = [] 26for student in student_list: 27 start.append(student["Start run"]) 28 29stop = [] 30for student in student_list: 31 stop.append(student["Stop run"]) 32 33rn = [] 34for student in student_list: 35 rn.append(student["Run"]) 36 37wd = [] 38for student in student_list: 39 wd.append(student["Wind"]) 40 41err = [] 42for student in student_list: 43 err.append(student["ERROR"]) 44 45#グラフ内のnonを削除 46rnZ = filter(None, rn) 47wdZ = filter(None, wd) 48errZ = filter(None, err) 49 50plt.rcParams['xtick.major.width'] = 1.3#x軸主目盛り線の線幅 51plt.rcParams['ytick.major.width'] = 1.3#y軸主目盛り線の線幅 52plt.rcParams['axes.linewidth'] = 1.3# 軸の線幅edge linewidth。囲みの太さ 53 54fig = plt.figure(figsize=(6.5,2.2),dpi=150)#図の大きさ、解像度 55ax1 = fig.add_subplot(1,1,1) 56ax1.yaxis.set_ticks_position('both')#y軸目盛両側 57ax1.xaxis.set_ticks_position('both')#x軸目盛両側 58for A, B, C in zip(start, stop, f): 59 if C == "non": 60 continue 61 if A is None: 62 continue 63 x = np.arange(A, B, 0.1) 64 y = np.arange(-10, 10, 0.1) 65 y = x + C - x 66 ax1.plot(x, y, color="black", linewidth=5) 67 68plt.xticks(np.arange(0, 100,10)) 69plt.ylim([0, 90]) 70plt.xlim([0, 100]) 71 72 73x2 = list(rnZ) 74y2 = list(wdZ) 75 76ax2 = ax1.twinx() 77ax2.scatter(x2, y2,marker="o",s=8, color = "green") 78plt.errorbar(x2, y2, yerr = list(errZ), capsize=5, fmt='o', markersize=8, ecolor='green', markeredgecolor = "green", color='green') 79 80ax2.set_yticks([0,5,10,15,20,25])#y2のプロット位置(強引) 81ax2.set_yticklabels([0,5,10,15,20,25])#何を表示するか(強引) 82 83plt.show()
回答1件
あなたの回答
tips
プレビュー


バッドをするには、ログインかつ
こちらの条件を満たす必要があります。
2020/07/07 09:45