


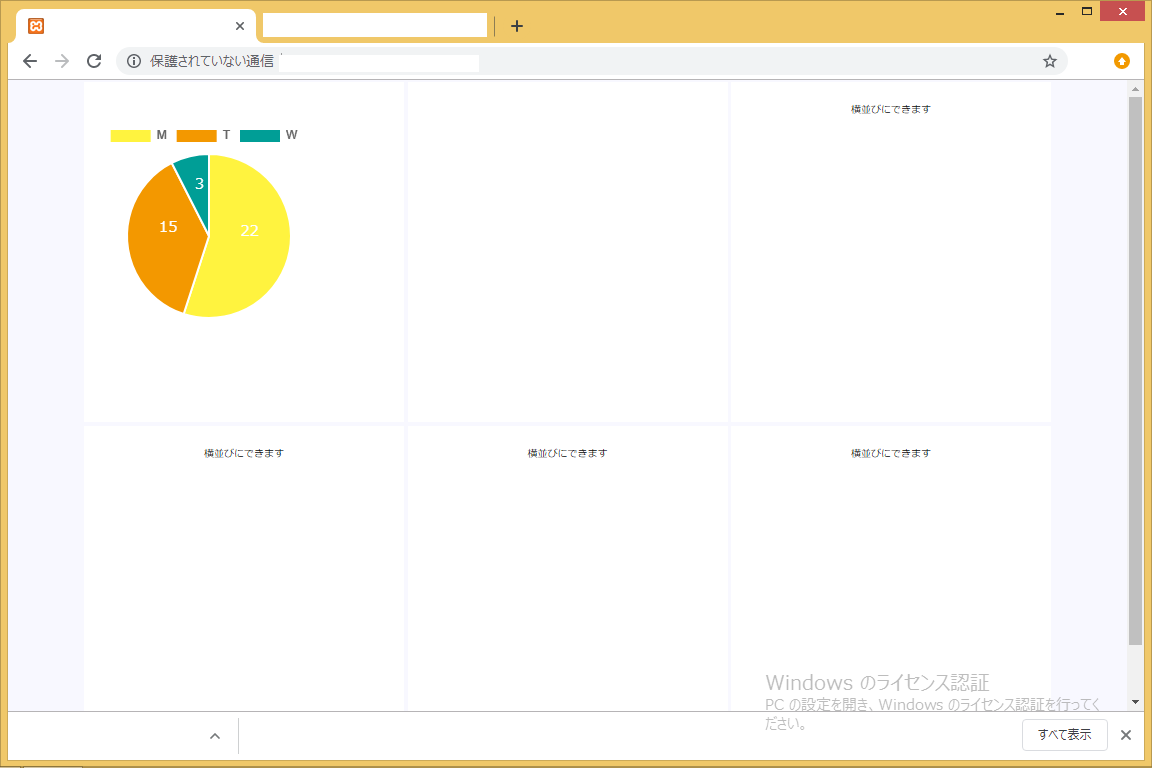
回答ありがとうございます。グラフが重なっていたことに気づきませんでした。position:relative;を追加し、うまく表示することができました。ありがとうございました。
javascript chart.jsを使用し、複数の円グラフを表示させたいのですが、1つしか表示されません。
記述方法などが、誤っているのでしょうか。ご指摘いただけると幸いです。
よろしくお願いします。
javascript
1<html lang="ja"> 2<head> 3<meta http-equiv="Content-Type" content="text/html; charset=UTF-8"/> 4<meta name="keywords"content="html,css,javascript"/> 5<script type="text/javascript" src=""></script> 6 <title>test</title> 7</head> 8<style> 9body{ 10 background-color:#f8f8ff; 11 color : #000000; 12 margin: 0 auto; 13 font-size:62.5%; 14} 15 16#header{ 17 width:auto; 18 height:30px; 19 background-color:#E9D922; 20 font-size:2.0em; 21 text-align : center; 22} 23 24#contents{ 25 width:1000px; 26 min-height:900px; 27 color : #000000; 28 margin: 0 auto; 29 margin-top:1.5%; 30 margin-bottom: 1.5%; 31 background-color :#E9D922; 32 font-size: 1.6em; 33 line-height: 1.5em; 34 border-radius: 15px; 35} 36 37.parent { 38 text-align: center; /* 子要素を左右中央揃えにする */ 39 border: solid 0px; /* 枠線指定 */ 40 padding: 2px; /* 余白指定 */ 41} 42 43.inline-block { 44 display: inline-block; /* インラインブロック要素にする */ 45 background-color: #ffffff; /* 背景色指定 */ 46 padding: 20px; /* 余白指定 */ 47 height: 300px; /* 高さ指定 */ 48 width: 280px; /* 幅指定 */ 49 vertical-align: middle; /* 要素を上下中央揃えにする */ 50} 51 52.headershadow { 53 box-shadow: 0 3px 6px rgba(0,0,0,0.1); /* 要素を上下中央揃えにする */ 54} 55 56p {text-align: center} 57 58</style> 59<body> 60<p> 61<div class="parent"> 62<div class="inline-block"> 63 <script src="https://cdnjs.cloudflare.com/ajax/libs/Chart.js/2.7.1/Chart.min.js"></script> 64<div style="position:absolute; top:40px; left:1px; width:400px; height:400px;"> 65<canvas id="myChart"> </canvas> 66<script> 67var ctx = document.getElementById("myChart").getContext('2d'); 68var myChart = new Chart(ctx, { 69 type: 'pie', 70 data: { 71 labels: ["M", "T", "W"], 72 datasets: [{ 73 backgroundColor: [ 74 "#fff33f", 75 "#f39800", 76 "#009e96" 77 ], 78 data: [22, 15, 3] 79 }] 80 } 81}); 82Chart.plugins.register({ 83 afterDatasetsDraw: function (chart, easing) { 84 // To only draw at the end of animation, check for easing === 1 85 var ctx = chart.ctx; 86 87 chart.data.datasets.forEach(function (dataset, i) { 88 var meta = chart.getDatasetMeta(i); 89 if (!meta.hidden) { 90 meta.data.forEach(function (element, index) { 91 // Draw the text in black, with the specified font 92 ctx.fillStyle = 'rgb(255, 255, 255)'; 93 94 var fontSize = 15; 95 var fontStyle = 'normal'; 96 var fontFamily = 'Helvetica Neue'; 97 ctx.font = Chart.helpers.fontString(fontSize, fontStyle, fontFamily); 98 99 // Just naively convert to string for now 100 var dataString = dataset.data[index].toString(); 101 102 // Make sure alignment settings are correct 103 ctx.textAlign = 'center'; 104 ctx.textBaseline = 'middle'; 105 106 var padding = 5; 107 var position = element.tooltipPosition(); 108 ctx.fillText(dataString, position.x, position.y - (fontSize / 2) - padding); 109 }); 110 } 111 }); 112 } 113}); 114</script> 115</div> 116</div> 117<div class="inline-block"> 118 <script src="https://cdnjs.cloudflare.com/ajax/libs/Chart.js/2.7.1/Chart.min.js"></script> 119<div style="position:absolute; top:40px; left:1px; width:400px; height:400px;"> 120<canvas id="myChart1"> </canvas> 121<script> 122var ctx = document.getElementById("myChart1").getContext('2d'); 123var myChart1 = new Chart(ctx, { 124 type: 'pie', 125 data: { 126 labels: ["M", "T", "W"], 127 datasets: [{ 128 backgroundColor: [ 129 "#fff33f", 130 "#f39800", 131 "#009e96" 132 ], 133 data: [22, 15, 3] 134 }] 135 } 136}); 137Chart.plugins.register({ 138 afterDatasetsDraw: function (chart, easing) { 139 // To only draw at the end of animation, check for easing === 1 140 var ctx = chart.ctx; 141 142 chart.data.datasets.forEach(function (dataset, i) { 143 var meta = chart.getDatasetMeta(i); 144 if (!meta.hidden) { 145 meta.data.forEach(function (element, index) { 146 // Draw the text in black, with the specified font 147 ctx.fillStyle = 'rgb(255, 255, 255)'; 148 149 var fontSize = 15; 150 var fontStyle = 'normal'; 151 var fontFamily = 'Helvetica Neue'; 152 ctx.font = Chart.helpers.fontString(fontSize, fontStyle, fontFamily); 153 154 // Just naively convert to string for now 155 var dataString = dataset.data[index].toString(); 156 157 // Make sure alignment settings are correct 158 ctx.textAlign = 'center'; 159 ctx.textBaseline = 'middle'; 160 161 var padding = 5; 162 var position = element.tooltipPosition(); 163 ctx.fillText(dataString, position.x, position.y - (fontSize / 2) - padding); 164 }); 165 } 166 }); 167 } 168}); 169</script> 170</div> 171</div> 172<div class="inline-block"> 173 横並びにできます 174</div> 175</div> 176 177<div class="parent"> 178<div class="inline-block"> 179 横並びにできます 180</div> 181<div class="inline-block"> 182 横並びにできます 183</div> 184<div class="inline-block"> 185 横並びにできます 186</div> 187</div> 188 189</body> 190</html> 191
回答2件
あなたの回答
tips
プレビュー


2019/08/20 02:16
2019/08/20 02:18