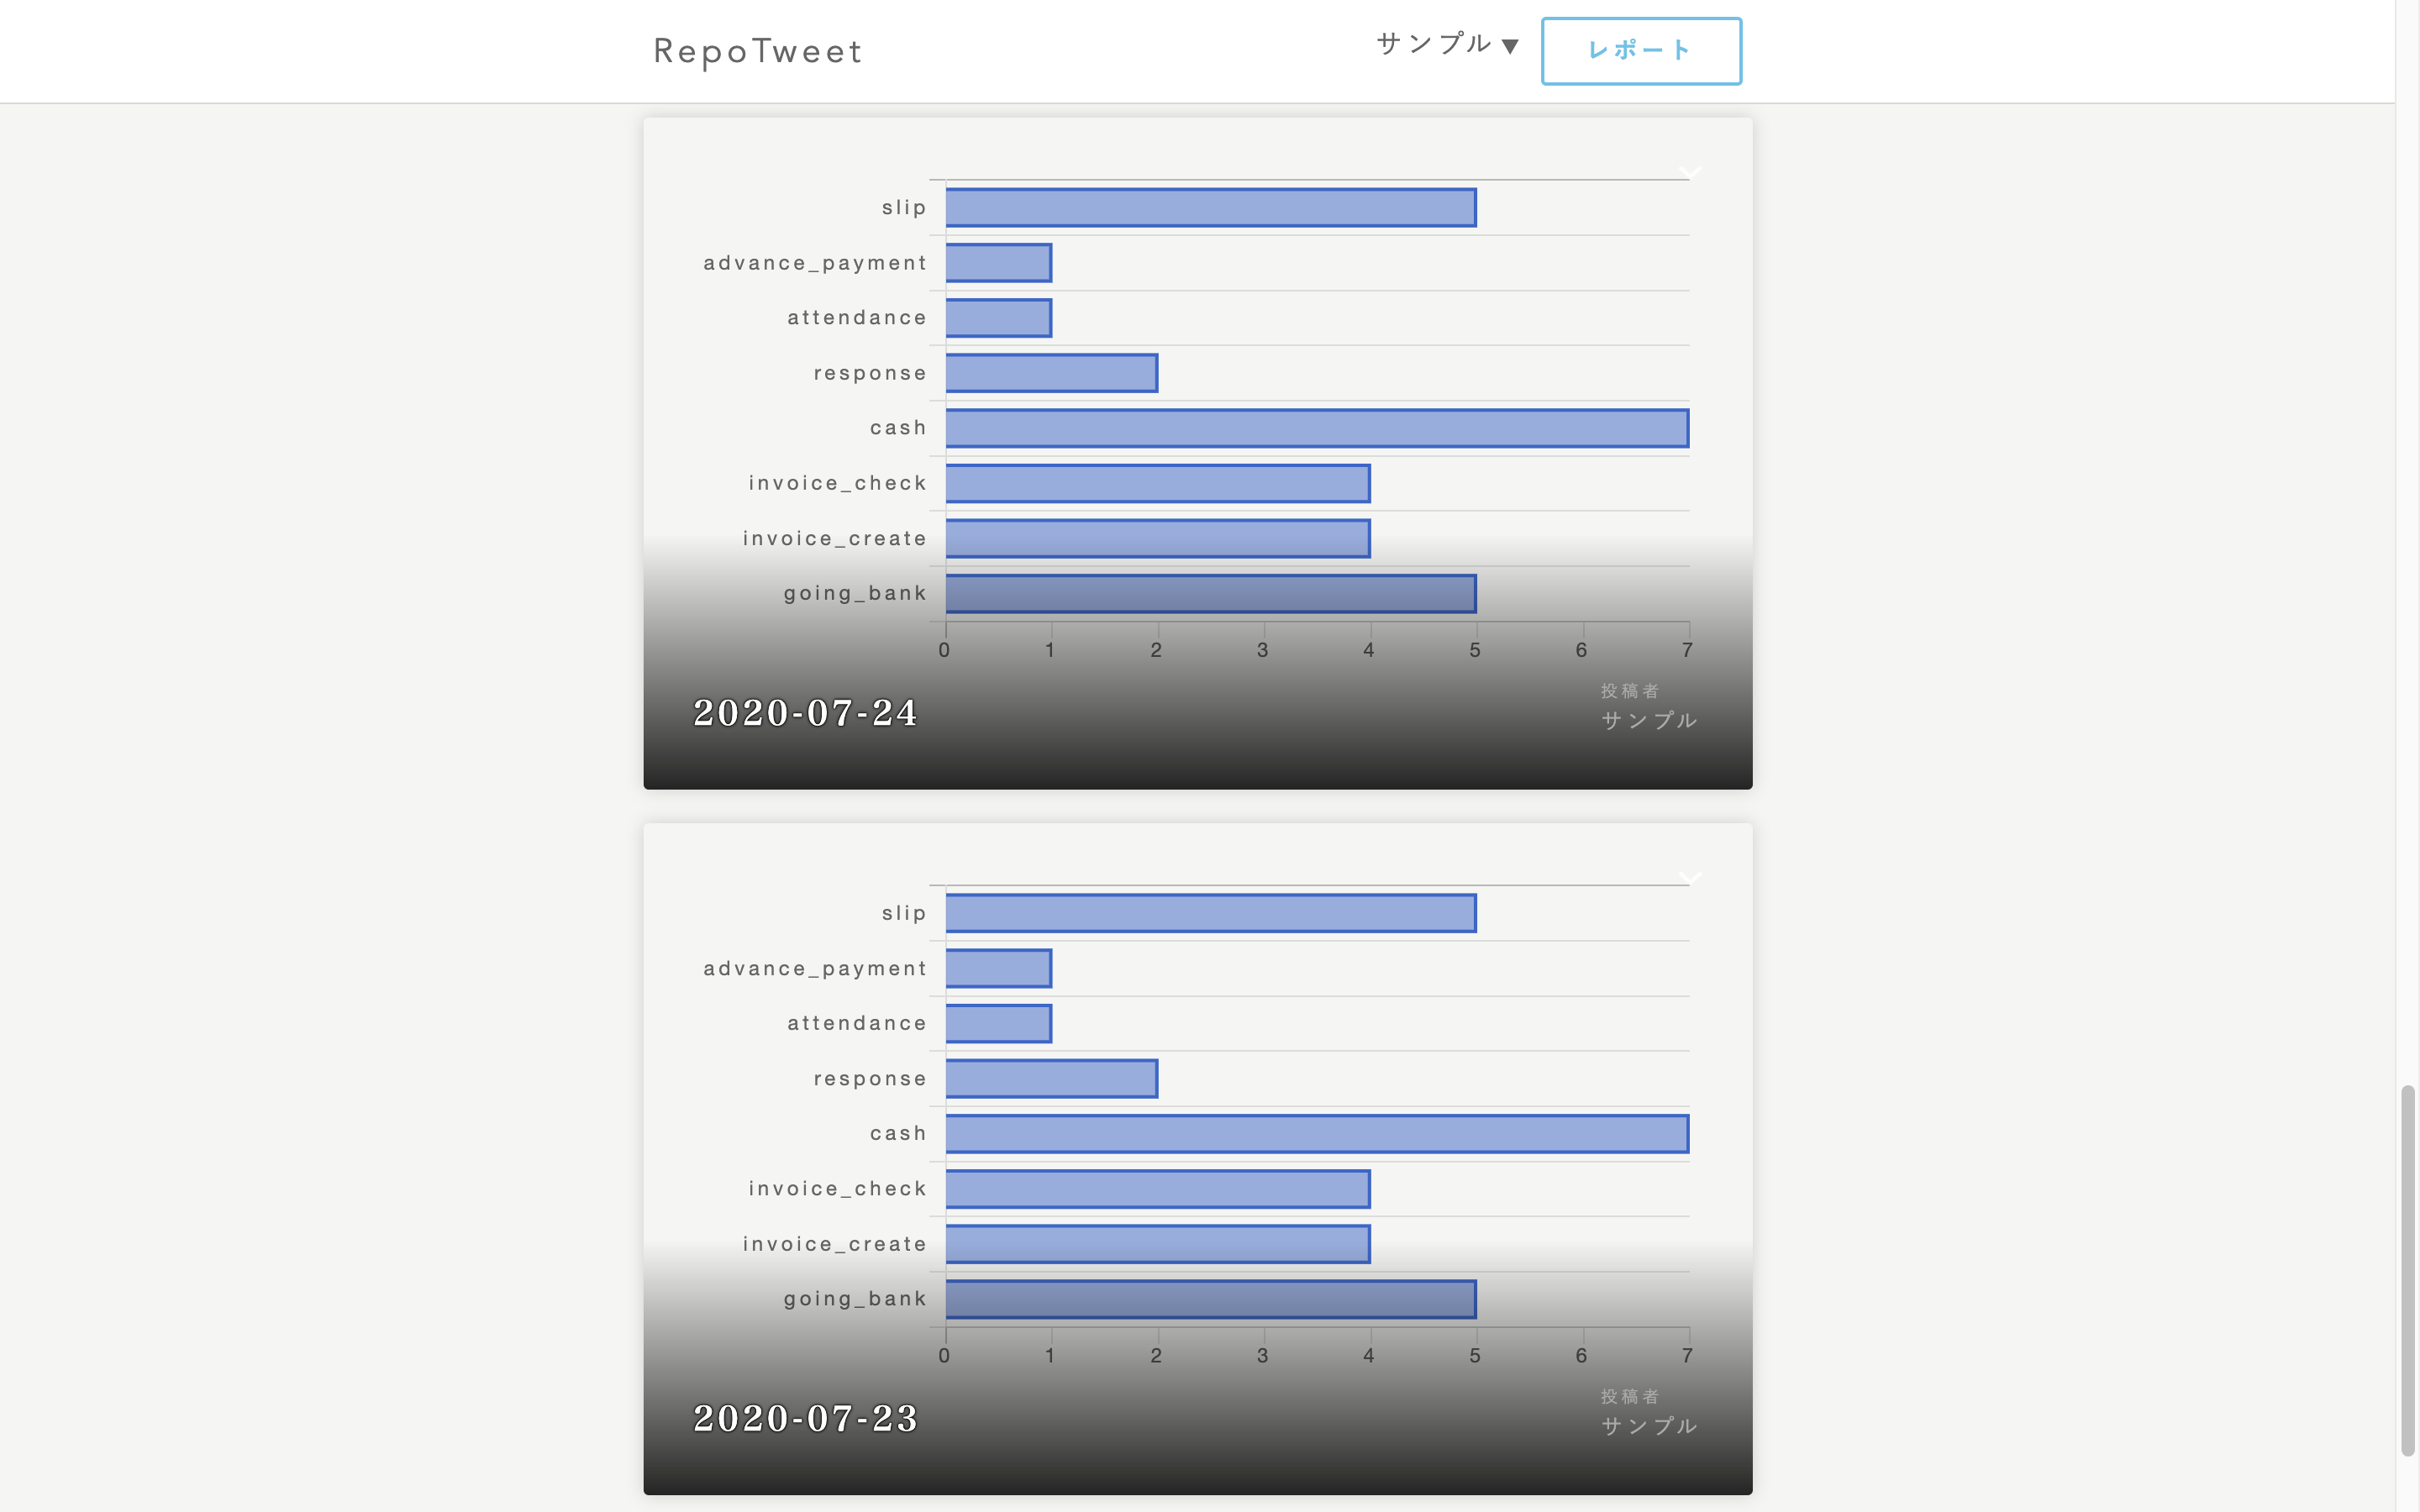
よろしくお願いします。
現在Railsでアプリ製作中でして、Chartkickのグラフを導入しております。
グラフの表示をレコードごとに表示させたいのですが、現状全てのグラフが同じ内容となってしまっています。
haml
1.contents.row 2 - @reports.each do |report| 3 .content_post 4 = bar_chart @data 5 .more 6 %span= image_tag 'arrow_top.png' 7 %ul.more_list 8 %li 9 = link_to '詳細', report_path(report.id), method: :get 10 - if user_signed_in? && current_user.id == report.user_id 11 %li 12 = link_to '編集', edit_report_path(report.id), method: :get 13 %li 14 = link_to '削除', report_path(report.id), method: :delete 15 %p= report.due 16 %span.name 17 %a{href: "/users/#{report.user.id}"} 18 %span 投稿者 19 = report.user.nickname
controller
1def index 2 @reports = Report.includes(:user).order("due DESC") 3 @data = Detail.group(:work).sum(:hour) 4end
each文で回しているので、恐らくコントローラーの@dataに付け足して記述するか何かだとは思うのですが、なかなか解決できません。ビュー画面とデータベースも添付いたしますのでご存知の方、ご回答のほどお願いいたします。


回答1件
あなたの回答
tips
プレビュー


バッドをするには、ログインかつ
こちらの条件を満たす必要があります。
2020/07/30 20:10 編集