

###前提・実現したいこと
閲覧ありがとうございます。
現在GoogleChartを色々と動かしているのですが、まずは以下のサイトを参考にグラフ表示を行いました。
https://developers.google.com/chart/interactive/docs/customizing_tooltip_content
グラフの表示はできたんですが、このグラフ間のすき間を完全に無くしたいというのが目標です。
そこで、下のコードにもあるように「bar: {groupWidth: "100%"} 」をoption内に入れるとすき間はその度合いによって狭まっていくみたいです。
php
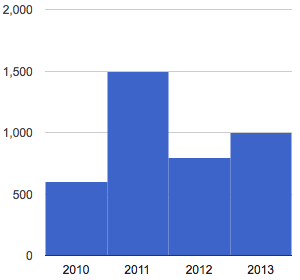
1<html> 2 <head> 3 <script type="text/javascript" src="https://www.gstatic.com/charts/loader.js"></script> 4 <script type="text/javascript"> 5 google.charts.load('current', {'packages':['corechart']}); 6 google.charts.setOnLoadCallback(drawChart); 7 8 function drawChart() { 9 var dataTable = new google.visualization.DataTable(); 10 dataTable.addColumn('string', 'Year'); 11 dataTable.addColumn('number', 'Sales'); 12 // A column for custom tooltip content 13 dataTable.addColumn({type: 'string', role: 'tooltip'}); 14 dataTable.addRows([ 15 ['2010', 600,'$600K in our first year!'], 16 ['2011', 1500, 'Sunspot activity made this our best year ever!'], 17 ['2012', 800, '$800K in 2012.'], 18 ['2013', 1000, '$1M in sales last year.'] 19 ]); 20 21 var options = { 22 tooltip: {isHtml: true}, 23 legend: 'none', 24 25//①この行を入れるとグラフとの隙間が狭まる 26 bar: {groupWidth: "100%"} 27 28 }; 29 var chart = new google.visualization.ColumnChart(document.getElementById('col_chart_html_tooltip')); 30 chart.draw(dataTable, options); 31 } 32 </script> 33 </head> 34 <body> 35 <!-- The next line rotates HTML tooltips by 30 degrees clockwise. --> 36 37 <!-- <style>div.google-visualization-tooltip { transform: rotate(30deg); }</style> --> <!--この行でToolTipを30度傾けてる--> 38 39 <div id="col_chart_html_tooltip" style="width: 400px; height: 400px;"></div> 40 </body> 41</html> 42
ですが、100%の最大にしても下図のようにすき間ができちゃうんですね。これをどうにかして完全にすき間を消したいです。どうすればいいのでしょうか?もしわかる方がいればご教示くださいm(_ _)m宜しくお願いします。
回答1件
あなたの回答
tips
プレビュー


バッドをするには、ログインかつ
こちらの条件を満たす必要があります。
2016/12/05 09:21