

以下のグラフで、凡例を棒グラフ内に入れる方法を教えていただけないでしょうか。
Python
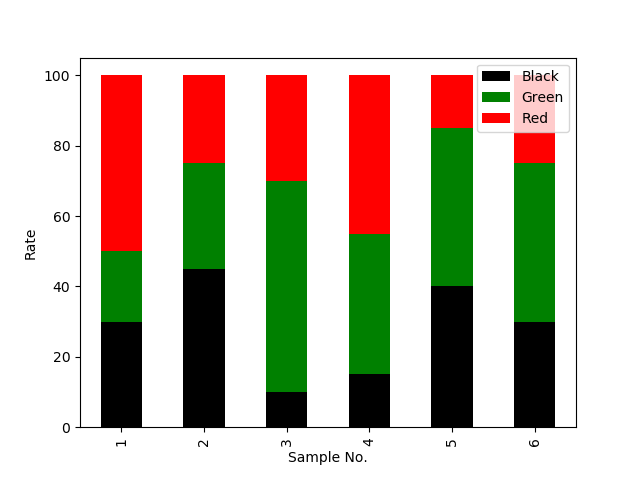
1import pandas as pd 2import matplotlib.pyplot as plt 3 4df = pd.DataFrame({'Sample No.':[1,2,3,4,5,6], 5 'Black':[30,45,10,15,40,30], 6 'Green': [20,30,60,40,45,45], 7 'Red': [50,25,30,45,15,25]}) 8df = df.set_index('Sample No.') 9ax = plt.subplot() 10df.plot.bar(stacked=True, color=['black', 'green', 'red'], ax=ax) 11ax.set_ylabel('Rate') 12plt.show()
出力した図
出力した図に手書きで入れたもの(凡例入れずに、凡例でかぶっている箇所も文字を入れたいです)

回答1件

あなたの回答
tips
プレビュー


バッドをするには、ログインかつ
こちらの条件を満たす必要があります。
退会済みユーザー
2020/01/13 03:10
退会済みユーザー
2020/01/13 03:19