

Python
1import sys, os 2import tkinter 3import matplotlib.pyplot as plt 4 5# レダーチャートを作る関数 6def plot_polar(labels, values, imgname): 7 angles = np.linspace(0, 2 * np.pi, len(labels) + 1, endpoint=True) 8 values = np.concatenate((values, [values[0]])) # 閉じた多角形にする 9 fig = plt.figure() 10 ax = fig.add_subplot(111, polar=True) 11 ax.plot(angles, values, 'o-') # 外枠 12 ax.fill(angles, values, alpha=0.25) # 塗りつぶし 13 ax.set_thetagrids(angles[:-1] * 180 / np.pi, labels) # 軸ラベル 14 ax.set_rlim(0 ,max(values)) 15 #fig.savefig(imgname) 16 #plt.close(fig) 17 18# button2クリック時の処理 19def button_clicked(): 20 labels = [a, b, c, d, e, f] 21 values = [int(Box.get()), int(Box1.get()), int(Box2.get()), int(Box3.get()), int(Box4.get()), int(Box5.get())] 22 23 #グラフ描画 24 plot_polar(labels, values, "rader.png") 25 26if __name__ == "__main__": 27 # tkinter 設定 28 root = tkinter.Tk() 29 root.title(u"Software Title") 30 root.geometry("800x700") 31 32 #エントリー 33 Box = tkinter.Entry(width=50) 34 Box.insert(tkinter.END,"変数1") 35 Box.pack() 36 37 Box1 = tkinter.Entry(width=50) 38 Box1.insert(tkinter.END,"変数2") 39 Box1.pack() 40 41 Box2 = tkinter.Entry(width=50) 42 Box2.insert(tkinter.END,"変数3") 43 Box2.pack() 44 45 Box3 = tkinter.Entry(width=50) 46 Box3.insert(tkinter.END,"変数4") 47 Box3.pack() 48 49 Box4 = tkinter.Entry(width=50) 50 Box4.insert(tkinter.END,"変数5") 51 Box4.pack() 52 53 Box5 = tkinter.Entry(width=50) 54 Box5.insert(tkinter.END,"変数6") 55 Box5.pack() 56 57 #グラフ作成ボタン 58 Button = tkinter.Button(text=u'グラフ作成', width=50) 59 Button.bind("<Button-1>",button_clicked) 60 #左クリック(<Button-1>)されると,DeleteEntryValue関数を呼び出すようにバインド 61 Button.pack() 62
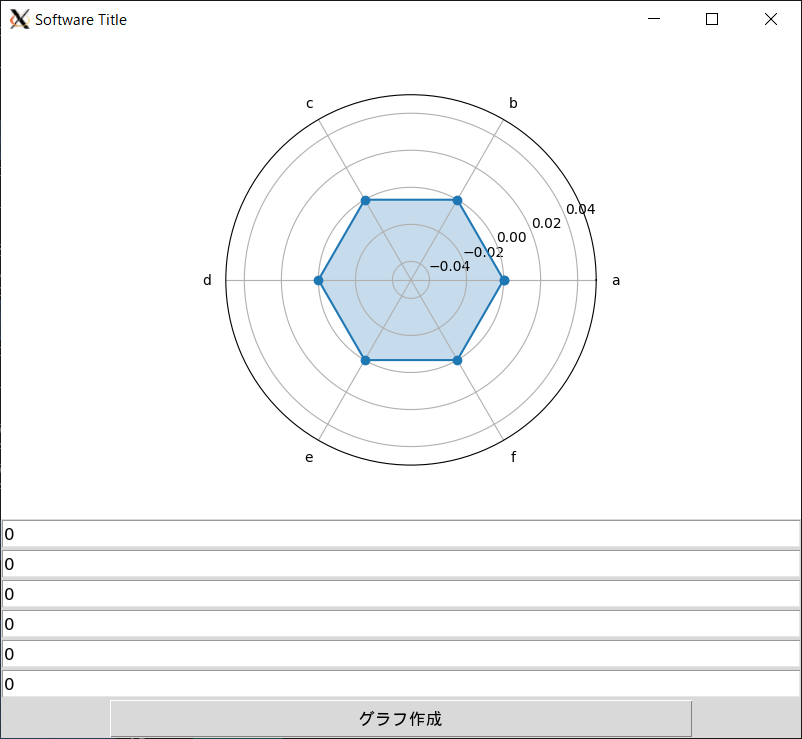
以上のように、変数を6つ分の値を入力して、入力した値でレーダーチャートを作成します。
作成したグラフをTkinterでつくったウィンドウ内に表示したいのですが、どのようにしたら良いでしょうか。
よろしくお願い致します。


バッドをするには、ログインかつ
こちらの条件を満たす必要があります。