

回転している場合の「x軸上に投影」はあるピクセル (x, y) をどの方向に投影するのでしょうか?
初めまして,python初心者です.
以下のようなデータ処理を行いたいのですが,プログラムのアイディアが浮かばず困っています.
どなたかお力をかしてもらえませんでしょうか.
python3.7.1 , Anaconda3ディストリビューションを利用しています.
なお,csvファイルを読み込みリスト型にするなどの,超基本的なことは一応できます.
図(a)に示す例のように格子状正方領域にデータがcsv形式で保存されています.このデータを読み込み,各ピクセルのデータをx軸上に投影するとともに,同軸を幅1ピクセルに区切り,投影されたデータ,並びにデータの平均値を取得したいです.図(a)の例のように軸が全く回転していない場合, x = 3 での投影データが[8,5,1,2,9,8]で平均値が5.5, x = -2 での投影データが[4,8,8,4,2,2]で平均値が4.67のようになることは容易に理解でき,計算できます.しかし,(b)に示すように軸を任意の角度Θ[deg]だけ回転させた場合,x軸に投影されるデータの所得方法がわかりません.以上のような作業を回転角0~180[deg]まで,1[deg]間隔で行い,データ処理をしたいのです.
稚拙な説明で申し訳ありませんが,以上が行いたいデータ処理となります.また,初心者でも理解できるように,コードの説明もしていただけたら大変助かります.
お願いばかりで申し訳ありませんが,ご回答をよろしくお願いします.
〈追記〉
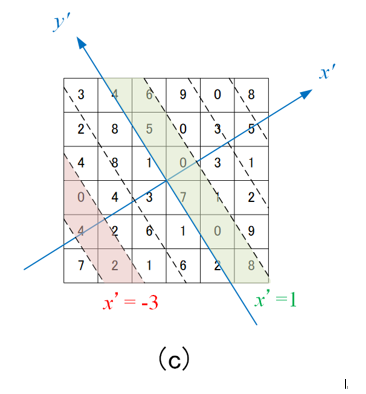
説明不足で申し訳ありません.図(c)を追加しています.図のx'y'座標系の場合,x' = 1での中の緑帯の領域に含まれる格子点のデータを参照するという意味です.各格子点の少しでも緑帯の領域に含まれていたら対象です.同様にx=-3での投影とは,図中の赤帯の領域に含まれる格子点のデータを参照するということです.また,xの座標値は整数値とします.(x = 0.5などでの投影は行いません.)
〈追記2〉
重ね重ね質問ばかりですいません.
回答者様のソースコードを参考にして,プログラムを作成できたのですが,以下の二点をさらに変更する必要が出てきました.
(1) 前回は「格子点の一部でも帯状領域に含まれていたら,そのx'座標上に投影する」としていましたが,図(d)のように「各格子点の中心(図中緑の点)が帯状領域に含まれていたら,そのx'座標上に投影する」というデータ処理を行えるように変更したいです.
(2) データを投影する対象となる点は,格子の一辺長さを直径とする円に含まれるものであること(図中の灰色部分は対象外となります.)
以上,2点を変更したいと考えていますが,どのように円形領域に変更し,中心座標を参照すればよいのかわかりません.
ご回答お待ちしております.


投影座標が整数ではない場合の集計方法の仕様が提示されるべきかと.
(→「整数」と言うと語弊がありそう…「中途半端な座標」とでも言えば良いか)
説明不足で申し訳ありません.
質問に追記を行いました.ご確認よろしくお願いします.
一旦クローズした質問で新たな質問が生じた場合は、再度 Open にするのではなく、新規に質問を立て直してください
「〈追記2〉」に関しては,その文面だけだと
(1)は中心位置のx'に基づき集計すれば良いだけの話になった(以前と比較して内容が単純化された)と見えるし,
(2)は中心位置の原点からの距離で集計対象とするか否かを判定すれば良いだけの話に見えるので,
問題点が一体何なのかが私には読み取れませんでした.
別途質問する場合には,一体何が困り事なのか?という点を明確にすると良いかと思います.
ご指摘ありがとうございます!
もう少し問題を具体的にした後,再度ご質問させていただきます.
ありがとうございました.
回答2件

あなたの回答
tips
プレビュー


