

行っていること
pyhotnのmatplotlibで棒グラフを作成しています.
自作プログラム
python
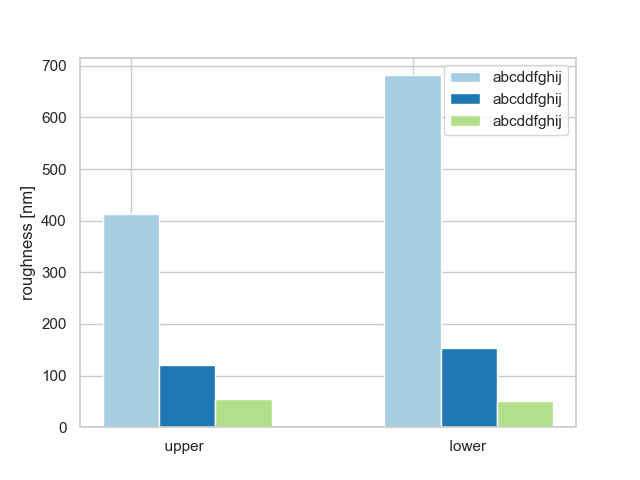
1import matplotlib.pyplot as plt 2import seaborn as sns 3import numpy as np 4 5sns.set() 6sns.set_style('whitegrid') 7sns.set_palette('Paired') 8 9x = np.array([' upper ', ' lower']) 10x_position = np.arange(len(x)) 11 12y_control = np.array([413.498, 681.650]) 13y_stress = np.array([120.333, 153.008]) 14y_example = np.array([55.375, 51.272]) 15 16fig = plt.figure() 17ax = fig.add_subplot(1, 1, 1) 18ax.bar(x_position, y_control, width=0.2, label='abcddfghij') 19ax.bar(x_position + 0.2, y_stress, width=0.2, label='abcddfghij') 20ax.bar(x_position + 0.4, y_example, width=0.2, label='abcddfghij') 21 22ax.legend(loc='upper right') 23ax.set_xticks(x_position + 0) 24ax.set_xticklabels(x) 25 26ax.set_xlabel('') 27ax.set_ylabel('roughness [nm]') 28 29 30plt.show() 31
出力グラフ
解決したいこと
解決したいことがいくつかあります.
①X軸ラベルですが,プログラムに書かれている様に,スペースを入力して各グラフの中心に移動させています.スペースでズラさずとも,グラフの中心に持っていくことはできるのでしょうか.可能であればやり方をご教示頂けると幸いです.
②各棒グラフのデータラベル(数値)をグラフの上に出したいです.参考書などを片手にいろいろ試しているものの上手く行きません.こちらもご教示頂けると幸いです.
③最後にですが,凡例の位置が近いのですが,これはズラしたりできるのでしょうか.
いくつも質問を搭載して申し訳ありませんが,ご回答して頂けると幸いです.
よろしくお願いいたします.
補足情報
python 3.6を使用しています.
回答1件
あなたの回答
tips
プレビュー


バッドをするには、ログインかつ
こちらの条件を満たす必要があります。
2019/02/24 11:44