

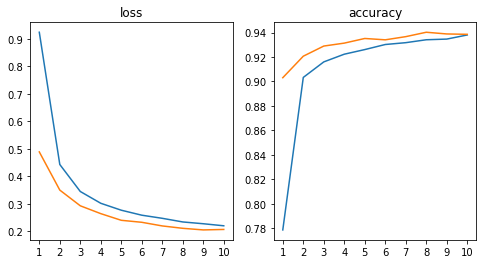
学習できていることはどのように確認したのでしょうか?hist.history['val_acc'] を print すると、どうなりますか?
学習の様子を可視化できないです。
・
・
・
# placeholders
input_sequence = Input((story_maxlen,))
question = Input((query_maxlen,))

# encoders
# embed the input sequence into a sequence of vectors
input_encoder_m = Sequential()
input_encoder_m.add(Embedding(input_dim=vocab_size,
                              output_dim=64))
input_encoder_m.add(Dropout(0.3))
# output: (samples, story_maxlen, embedding_dim)

# embed the input into a sequence of vectors of size query_maxlen
input_encoder_c = Sequential()
input_encoder_c.add(Embedding(input_dim=vocab_size,
                              output_dim=query_maxlen))
input_encoder_c.add(Dropout(0.3))
# output: (samples, story_maxlen, query_maxlen)

# embed the question into a sequence of vectors
question_encoder = Sequential()
question_encoder.add(Embedding(input_dim=vocab_size,
                               output_dim=64,
                               input_length=query_maxlen))
question_encoder.add(Dropout(0.3))
# output: (samples, query_maxlen, embedding_dim)

# encode input sequence and questions (which are indices)
# to sequences of dense vectors
input_encoded_m = input_encoder_m(input_sequence)
input_encoded_c = input_encoder_c(input_sequence)
question_encoded = question_encoder(question)

# compute a 'match' between the first input vector sequence
# and the question vector sequence
# shape: `(samples, story_maxlen, query_maxlen)`
match = dot([input_encoded_m, question_encoded], axes=(2, 2))
match = Activation('softmax')(match)

# add the match matrix with the second input vector sequence
response = add([match, input_encoded_c])  # (samples, story_maxlen, query_maxlen)
response = Permute((2, 1))(response)  # (samples, query_maxlen, story_maxlen)

# concatenate the match matrix with the question vector sequence
answer = concatenate([response, question_encoded])

# the original paper uses a matrix multiplication for this reduction step.
# we choose to use a RNN instead.
answer = LSTM(32)(answer)  # (samples, 32)

# one regularization layer -- more would probably be needed.
answer = Dropout(0.3)(answer)
answer = Dense(vocab_size)(answer)  # (samples, vocab_size)
# we output a probability distribution over the vocabulary
answer = Activation('softmax')(answer)

# build the final model
model = Model([input_sequence, question], answer)
model.compile(optimizer='rmsprop', loss='categorical_crossentropy',
              metrics=['accuracy'])

# train
hist = model.fit([inputs_train, queries_train], answers_train,
          batch_size=32,
          epochs=120,
          validation_data=([inputs_test, queries_test], answers_test))


model_path1 = 'model1.h5'
model.save(model_path1)

val_acc = hist.history['val_acc']

plt.rc('font',family='serif')
fig = plt.figure()
plt.plot(range(240),val_acc,label='acc',color='black')
plt.xlabel('epochs')
plt.show()
のようにコードを書いて学習の様子を可視化しようとしました。
しかし、何エポックになってもy軸が0のところにずっと線が引かれており学習の様子を可視化できませんでした。学習自体はできており、可視化がだけがうまくいっていないです。なぜうまく行かないのでしょうか?
予測と予測結果が表示されているからです。
hist.history['val_acc']は、[0.0, 0.0, 0.0, 0.0, 0.0, 0.0・・・・0.0]のようになっています
model.fit() で学習を開始すると、学習やバリデーションの accuracy が表示されていると思いますが、そちらはちゃんと精度が出ているけど、history の値は全部0ということでしょうか?
はい、そうです
model.fit() の返り値について回答にて整理しました。
Keras のコードを確認しましたが、history にある値は、model.fit() のときに表示される値と同じになるはずです。
お手数ですが、`acc` でなく、`val_acc` の値がどうなっているか確認できますか。
回答1件
あなたの回答
tips
プレビュー


